South African vs Immigrants from Lithuania Associate's Degree
COMPARE
South African
Immigrants from Lithuania
Associate's Degree
Associate's Degree Comparison
South Africans
Immigrants from Lithuania
51.4%
ASSOCIATE'S DEGREE
99.7/ 100
METRIC RATING
63rd/ 347
METRIC RANK
52.4%
ASSOCIATE'S DEGREE
99.9/ 100
METRIC RATING
45th/ 347
METRIC RANK
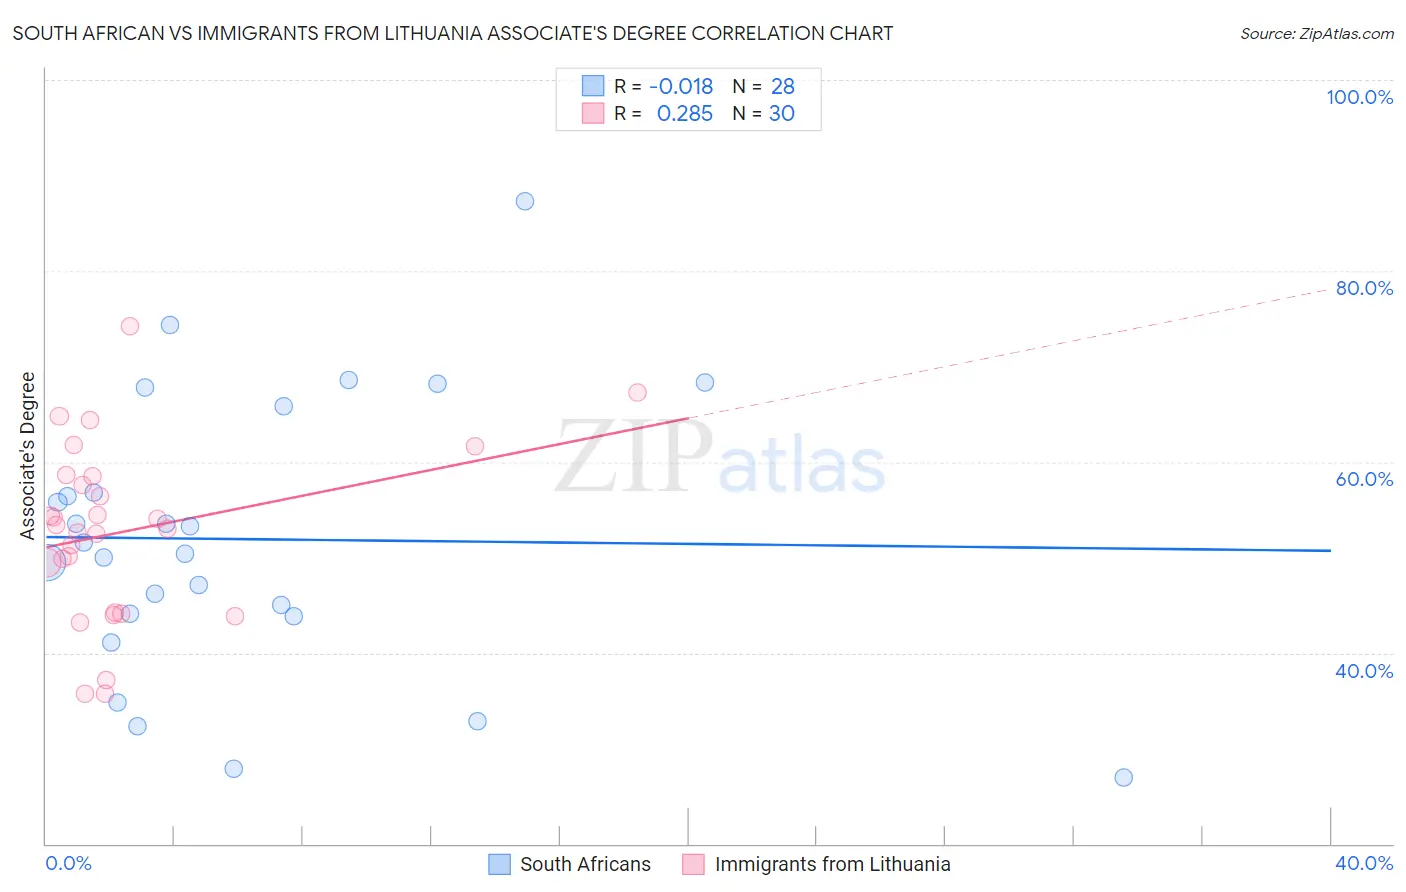
South African vs Immigrants from Lithuania Associate's Degree Correlation Chart
The statistical analysis conducted on geographies consisting of 182,596,530 people shows no correlation between the proportion of South Africans and percentage of population with at least associate's degree education in the United States with a correlation coefficient (R) of -0.018 and weighted average of 51.4%. Similarly, the statistical analysis conducted on geographies consisting of 117,722,731 people shows a weak positive correlation between the proportion of Immigrants from Lithuania and percentage of population with at least associate's degree education in the United States with a correlation coefficient (R) of 0.285 and weighted average of 52.4%, a difference of 2.0%.
Associate's Degree Correlation Summary
| Measurement | South African | Immigrants from Lithuania |
| Minimum | 26.9% | 35.7% |
| Maximum | 87.3% | 74.3% |
| Range | 60.4% | 38.5% |
| Mean | 51.9% | 52.7% |
| Median | 50.9% | 53.2% |
| Interquartile 25% (IQ1) | 44.0% | 44.2% |
| Interquartile 75% (IQ3) | 61.2% | 58.5% |
| Interquartile Range (IQR) | 17.3% | 14.3% |
| Standard Deviation (Sample) | 14.5% | 9.2% |
| Standard Deviation (Population) | 14.2% | 9.1% |
Demographics Similar to South Africans and Immigrants from Lithuania by Associate's Degree
In terms of associate's degree, the demographic groups most similar to South Africans are Bhutanese (51.4%, a difference of 0.050%), Immigrants from Kazakhstan (51.4%, a difference of 0.060%), Immigrants from Netherlands (51.4%, a difference of 0.070%), Immigrants from Bolivia (51.5%, a difference of 0.21%), and Immigrants from Serbia (51.7%, a difference of 0.66%). Similarly, the demographic groups most similar to Immigrants from Lithuania are Estonian (52.5%, a difference of 0.080%), Immigrants from Bulgaria (52.4%, a difference of 0.13%), Immigrants from Kuwait (52.4%, a difference of 0.14%), Immigrants from Norway (52.2%, a difference of 0.41%), and Immigrants from Austria (52.1%, a difference of 0.61%).
| Demographics | Rating | Rank | Associate's Degree |
| Estonians | 99.9 /100 | #44 | Exceptional 52.5% |
| Immigrants | Lithuania | 99.9 /100 | #45 | Exceptional 52.4% |
| Immigrants | Bulgaria | 99.9 /100 | #46 | Exceptional 52.4% |
| Immigrants | Kuwait | 99.9 /100 | #47 | Exceptional 52.4% |
| Immigrants | Norway | 99.9 /100 | #48 | Exceptional 52.2% |
| Immigrants | Austria | 99.9 /100 | #49 | Exceptional 52.1% |
| Asians | 99.9 /100 | #50 | Exceptional 52.1% |
| Immigrants | Greece | 99.9 /100 | #51 | Exceptional 52.1% |
| Bolivians | 99.8 /100 | #52 | Exceptional 52.0% |
| Immigrants | Asia | 99.8 /100 | #53 | Exceptional 52.0% |
| Immigrants | Spain | 99.8 /100 | #54 | Exceptional 51.9% |
| Australians | 99.8 /100 | #55 | Exceptional 51.9% |
| Immigrants | Czechoslovakia | 99.8 /100 | #56 | Exceptional 51.9% |
| Paraguayans | 99.8 /100 | #57 | Exceptional 51.8% |
| New Zealanders | 99.8 /100 | #58 | Exceptional 51.8% |
| Immigrants | Serbia | 99.8 /100 | #59 | Exceptional 51.7% |
| Immigrants | Bolivia | 99.7 /100 | #60 | Exceptional 51.5% |
| Immigrants | Kazakhstan | 99.7 /100 | #61 | Exceptional 51.4% |
| Bhutanese | 99.7 /100 | #62 | Exceptional 51.4% |
| South Africans | 99.7 /100 | #63 | Exceptional 51.4% |
| Immigrants | Netherlands | 99.7 /100 | #64 | Exceptional 51.4% |