Cherokee vs Immigrants from Lithuania Associate's Degree
COMPARE
Cherokee
Immigrants from Lithuania
Associate's Degree
Associate's Degree Comparison
Cherokee
Immigrants from Lithuania
38.9%
ASSOCIATE'S DEGREE
0.0/ 100
METRIC RATING
296th/ 347
METRIC RANK
52.4%
ASSOCIATE'S DEGREE
99.9/ 100
METRIC RATING
45th/ 347
METRIC RANK
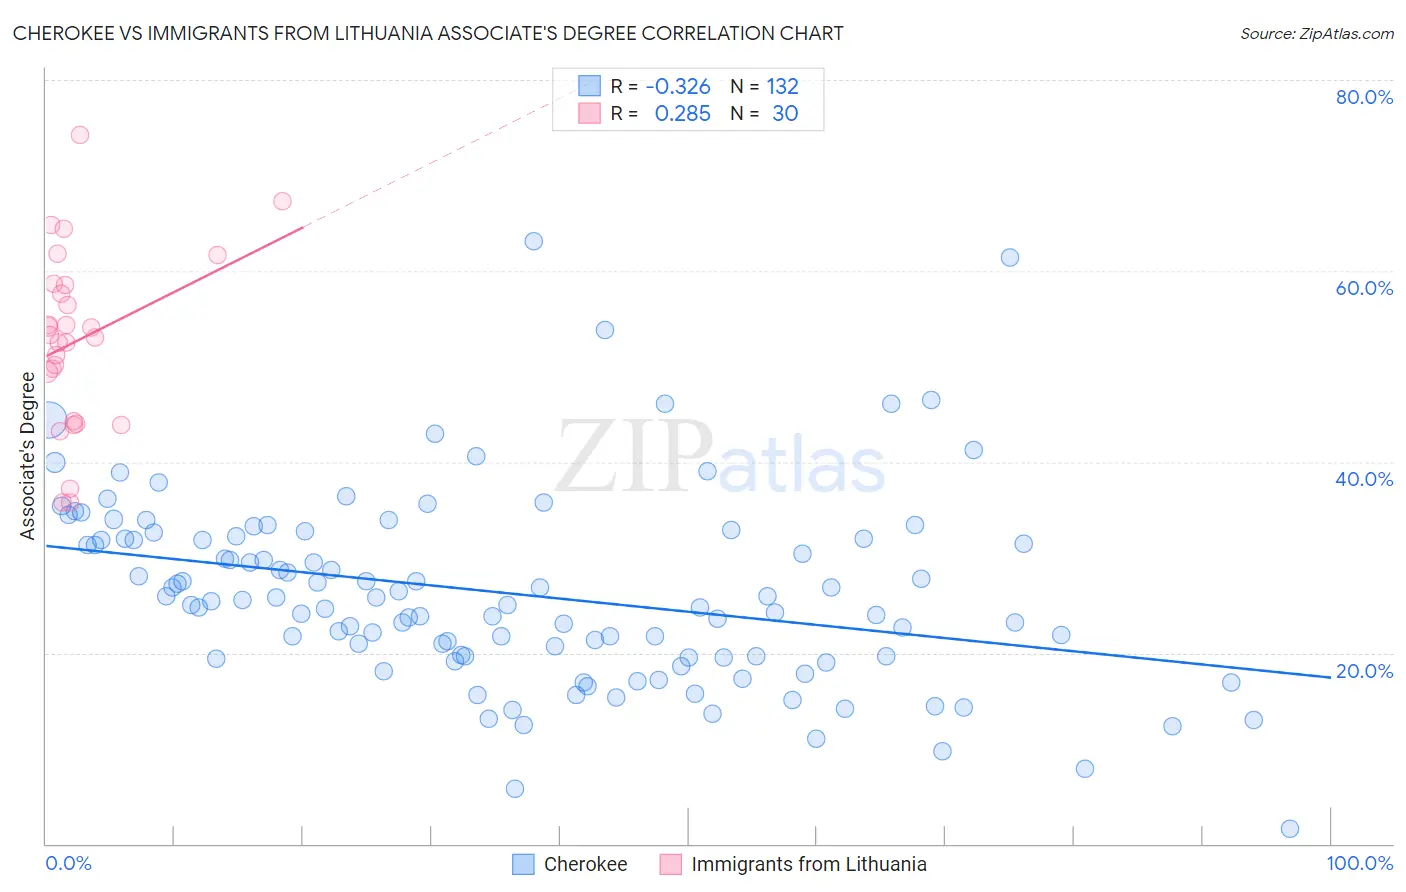
Cherokee vs Immigrants from Lithuania Associate's Degree Correlation Chart
The statistical analysis conducted on geographies consisting of 493,690,336 people shows a mild negative correlation between the proportion of Cherokee and percentage of population with at least associate's degree education in the United States with a correlation coefficient (R) of -0.326 and weighted average of 38.9%. Similarly, the statistical analysis conducted on geographies consisting of 117,722,731 people shows a weak positive correlation between the proportion of Immigrants from Lithuania and percentage of population with at least associate's degree education in the United States with a correlation coefficient (R) of 0.285 and weighted average of 52.4%, a difference of 34.9%.
Associate's Degree Correlation Summary
| Measurement | Cherokee | Immigrants from Lithuania |
| Minimum | 1.6% | 35.7% |
| Maximum | 63.1% | 74.3% |
| Range | 61.4% | 38.5% |
| Mean | 26.2% | 52.7% |
| Median | 25.3% | 53.2% |
| Interquartile 25% (IQ1) | 19.6% | 44.2% |
| Interquartile 75% (IQ3) | 31.9% | 58.5% |
| Interquartile Range (IQR) | 12.3% | 14.3% |
| Standard Deviation (Sample) | 10.0% | 9.2% |
| Standard Deviation (Population) | 10.0% | 9.1% |
Similar Demographics by Associate's Degree
Demographics Similar to Cherokee by Associate's Degree
In terms of associate's degree, the demographic groups most similar to Cherokee are Honduran (38.9%, a difference of 0.17%), Cape Verdean (38.8%, a difference of 0.28%), Nepalese (39.0%, a difference of 0.46%), Salvadoran (39.0%, a difference of 0.46%), and Cheyenne (38.7%, a difference of 0.55%).
| Demographics | Rating | Rank | Associate's Degree |
| Central Americans | 0.0 /100 | #289 | Tragic 39.4% |
| Immigrants | Haiti | 0.0 /100 | #290 | Tragic 39.3% |
| Dominicans | 0.0 /100 | #291 | Tragic 39.3% |
| Blacks/African Americans | 0.0 /100 | #292 | Tragic 39.1% |
| Nepalese | 0.0 /100 | #293 | Tragic 39.0% |
| Salvadorans | 0.0 /100 | #294 | Tragic 39.0% |
| Hondurans | 0.0 /100 | #295 | Tragic 38.9% |
| Cherokee | 0.0 /100 | #296 | Tragic 38.9% |
| Cape Verdeans | 0.0 /100 | #297 | Tragic 38.8% |
| Cheyenne | 0.0 /100 | #298 | Tragic 38.7% |
| Ute | 0.0 /100 | #299 | Tragic 38.6% |
| Chickasaw | 0.0 /100 | #300 | Tragic 38.6% |
| Tsimshian | 0.0 /100 | #301 | Tragic 38.6% |
| Colville | 0.0 /100 | #302 | Tragic 38.5% |
| Guatemalans | 0.0 /100 | #303 | Tragic 38.5% |
Demographics Similar to Immigrants from Lithuania by Associate's Degree
In terms of associate's degree, the demographic groups most similar to Immigrants from Lithuania are Estonian (52.5%, a difference of 0.080%), Immigrants from Bulgaria (52.4%, a difference of 0.13%), Immigrants from Kuwait (52.4%, a difference of 0.14%), Immigrants from South Africa (52.5%, a difference of 0.16%), and Immigrants from Malaysia (52.5%, a difference of 0.17%).
| Demographics | Rating | Rank | Associate's Degree |
| Mongolians | 100.0 /100 | #38 | Exceptional 53.0% |
| Immigrants | Belarus | 99.9 /100 | #39 | Exceptional 52.8% |
| Immigrants | Latvia | 99.9 /100 | #40 | Exceptional 52.8% |
| Immigrants | Saudi Arabia | 99.9 /100 | #41 | Exceptional 52.6% |
| Immigrants | Malaysia | 99.9 /100 | #42 | Exceptional 52.5% |
| Immigrants | South Africa | 99.9 /100 | #43 | Exceptional 52.5% |
| Estonians | 99.9 /100 | #44 | Exceptional 52.5% |
| Immigrants | Lithuania | 99.9 /100 | #45 | Exceptional 52.4% |
| Immigrants | Bulgaria | 99.9 /100 | #46 | Exceptional 52.4% |
| Immigrants | Kuwait | 99.9 /100 | #47 | Exceptional 52.4% |
| Immigrants | Norway | 99.9 /100 | #48 | Exceptional 52.2% |
| Immigrants | Austria | 99.9 /100 | #49 | Exceptional 52.1% |
| Asians | 99.9 /100 | #50 | Exceptional 52.1% |
| Immigrants | Greece | 99.9 /100 | #51 | Exceptional 52.1% |
| Bolivians | 99.8 /100 | #52 | Exceptional 52.0% |