Chinese vs Immigrants from Lithuania Associate's Degree
COMPARE
Chinese
Immigrants from Lithuania
Associate's Degree
Associate's Degree Comparison
Chinese
Immigrants from Lithuania
48.5%
ASSOCIATE'S DEGREE
92.5/ 100
METRIC RATING
125th/ 347
METRIC RANK
52.4%
ASSOCIATE'S DEGREE
99.9/ 100
METRIC RATING
45th/ 347
METRIC RANK
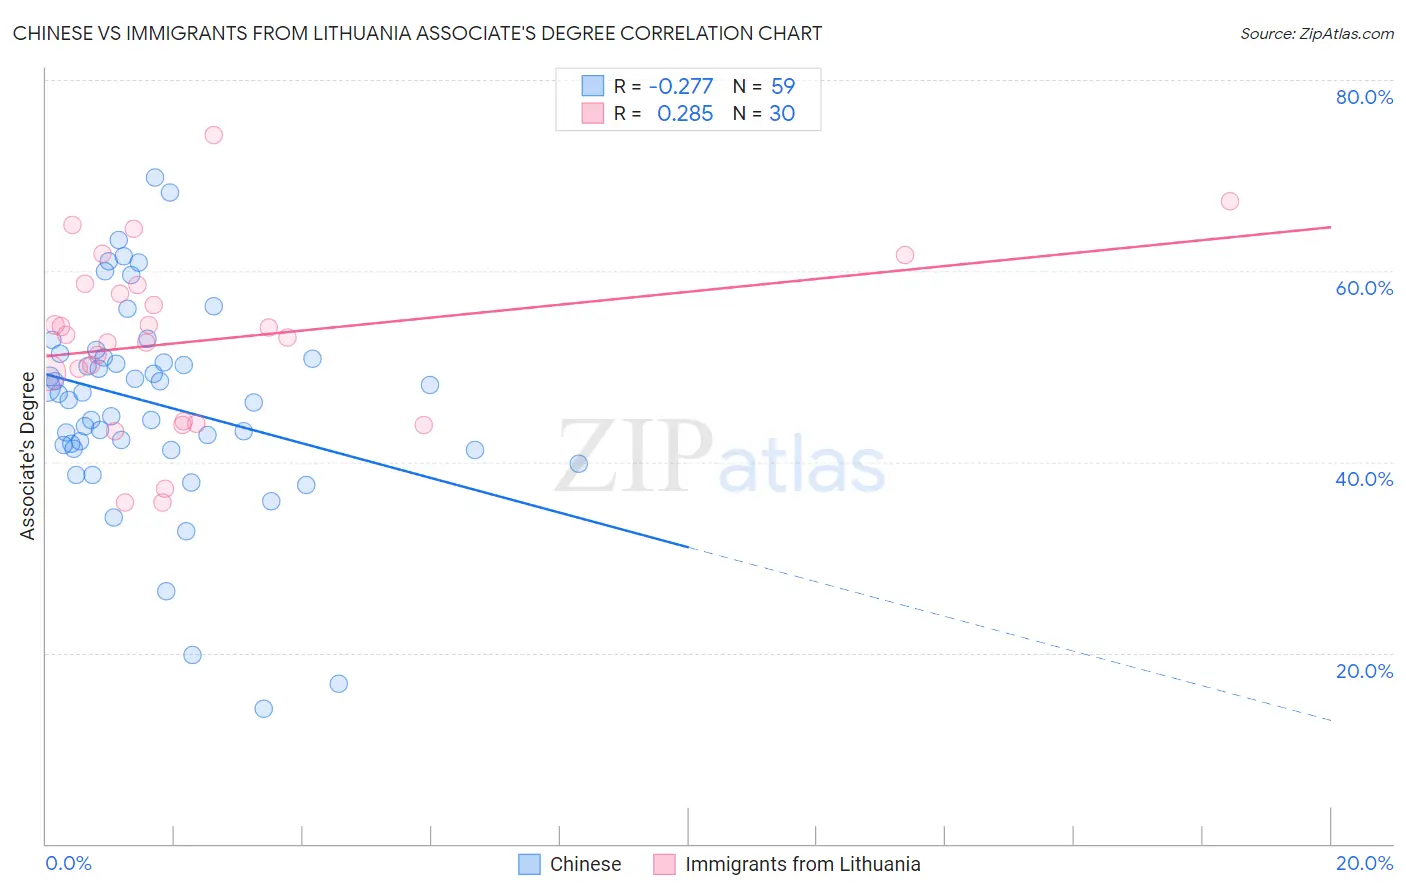
Chinese vs Immigrants from Lithuania Associate's Degree Correlation Chart
The statistical analysis conducted on geographies consisting of 64,809,883 people shows a weak negative correlation between the proportion of Chinese and percentage of population with at least associate's degree education in the United States with a correlation coefficient (R) of -0.277 and weighted average of 48.5%. Similarly, the statistical analysis conducted on geographies consisting of 117,722,731 people shows a weak positive correlation between the proportion of Immigrants from Lithuania and percentage of population with at least associate's degree education in the United States with a correlation coefficient (R) of 0.285 and weighted average of 52.4%, a difference of 8.1%.
Associate's Degree Correlation Summary
| Measurement | Chinese | Immigrants from Lithuania |
| Minimum | 14.2% | 35.7% |
| Maximum | 69.8% | 74.3% |
| Range | 55.6% | 38.5% |
| Mean | 46.1% | 52.7% |
| Median | 47.1% | 53.2% |
| Interquartile 25% (IQ1) | 41.4% | 44.2% |
| Interquartile 75% (IQ3) | 50.9% | 58.5% |
| Interquartile Range (IQR) | 9.5% | 14.3% |
| Standard Deviation (Sample) | 10.8% | 9.2% |
| Standard Deviation (Population) | 10.7% | 9.1% |
Similar Demographics by Associate's Degree
Demographics Similar to Chinese by Associate's Degree
In terms of associate's degree, the demographic groups most similar to Chinese are Serbian (48.5%, a difference of 0.020%), Immigrants from Syria (48.5%, a difference of 0.090%), Immigrants from Uganda (48.5%, a difference of 0.10%), Immigrants from Eastern Africa (48.4%, a difference of 0.22%), and Swedish (48.4%, a difference of 0.25%).
| Demographics | Rating | Rank | Associate's Degree |
| Albanians | 94.7 /100 | #118 | Exceptional 48.8% |
| Lebanese | 94.6 /100 | #119 | Exceptional 48.8% |
| Alsatians | 94.6 /100 | #120 | Exceptional 48.8% |
| Ugandans | 93.9 /100 | #121 | Exceptional 48.7% |
| Italians | 93.9 /100 | #122 | Exceptional 48.7% |
| Brazilians | 93.7 /100 | #123 | Exceptional 48.7% |
| Serbians | 92.6 /100 | #124 | Exceptional 48.5% |
| Chinese | 92.5 /100 | #125 | Exceptional 48.5% |
| Immigrants | Syria | 92.2 /100 | #126 | Exceptional 48.5% |
| Immigrants | Uganda | 92.1 /100 | #127 | Exceptional 48.5% |
| Immigrants | Eastern Africa | 91.6 /100 | #128 | Exceptional 48.4% |
| Swedes | 91.5 /100 | #129 | Exceptional 48.4% |
| Immigrants | Jordan | 91.2 /100 | #130 | Exceptional 48.4% |
| Icelanders | 90.8 /100 | #131 | Exceptional 48.3% |
| Immigrants | Albania | 89.9 /100 | #132 | Excellent 48.2% |
Demographics Similar to Immigrants from Lithuania by Associate's Degree
In terms of associate's degree, the demographic groups most similar to Immigrants from Lithuania are Estonian (52.5%, a difference of 0.080%), Immigrants from Bulgaria (52.4%, a difference of 0.13%), Immigrants from Kuwait (52.4%, a difference of 0.14%), Immigrants from South Africa (52.5%, a difference of 0.16%), and Immigrants from Malaysia (52.5%, a difference of 0.17%).
| Demographics | Rating | Rank | Associate's Degree |
| Mongolians | 100.0 /100 | #38 | Exceptional 53.0% |
| Immigrants | Belarus | 99.9 /100 | #39 | Exceptional 52.8% |
| Immigrants | Latvia | 99.9 /100 | #40 | Exceptional 52.8% |
| Immigrants | Saudi Arabia | 99.9 /100 | #41 | Exceptional 52.6% |
| Immigrants | Malaysia | 99.9 /100 | #42 | Exceptional 52.5% |
| Immigrants | South Africa | 99.9 /100 | #43 | Exceptional 52.5% |
| Estonians | 99.9 /100 | #44 | Exceptional 52.5% |
| Immigrants | Lithuania | 99.9 /100 | #45 | Exceptional 52.4% |
| Immigrants | Bulgaria | 99.9 /100 | #46 | Exceptional 52.4% |
| Immigrants | Kuwait | 99.9 /100 | #47 | Exceptional 52.4% |
| Immigrants | Norway | 99.9 /100 | #48 | Exceptional 52.2% |
| Immigrants | Austria | 99.9 /100 | #49 | Exceptional 52.1% |
| Asians | 99.9 /100 | #50 | Exceptional 52.1% |
| Immigrants | Greece | 99.9 /100 | #51 | Exceptional 52.1% |
| Bolivians | 99.8 /100 | #52 | Exceptional 52.0% |