Immigrants from Bulgaria vs Immigrants from Belarus College, 1 year or more
COMPARE
Immigrants from Bulgaria
Immigrants from Belarus
College, 1 year or more
College, 1 year or more Comparison
Immigrants from Bulgaria
Immigrants from Belarus
64.6%
COLLEGE, 1 YEAR OR MORE
99.9/ 100
METRIC RATING
48th/ 347
METRIC RANK
64.1%
COLLEGE, 1 YEAR OR MORE
99.7/ 100
METRIC RATING
55th/ 347
METRIC RANK
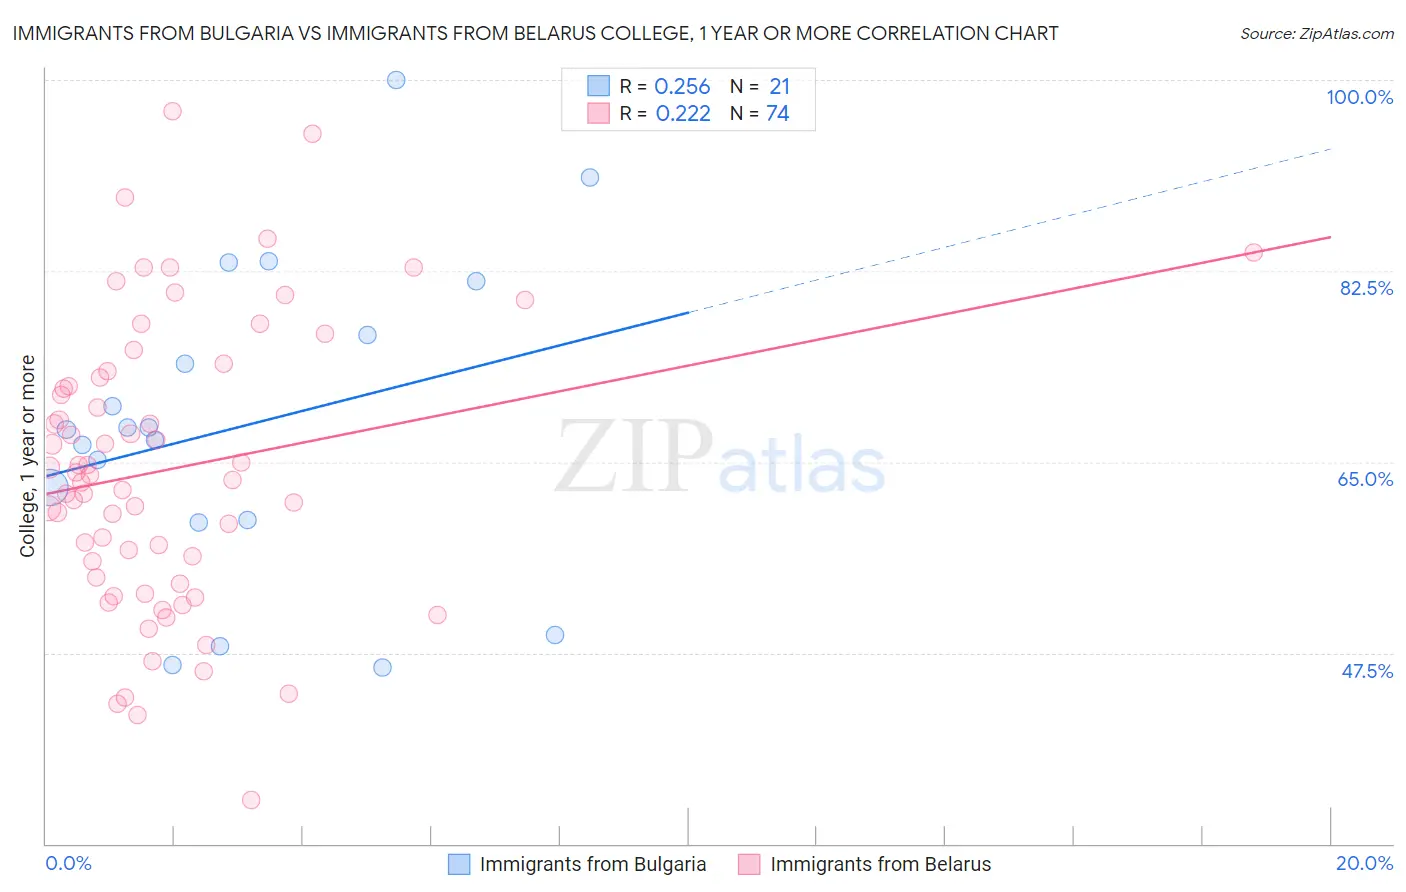
Immigrants from Bulgaria vs Immigrants from Belarus College, 1 year or more Correlation Chart
The statistical analysis conducted on geographies consisting of 172,550,092 people shows a weak positive correlation between the proportion of Immigrants from Bulgaria and percentage of population with at least college, 1 year or more education in the United States with a correlation coefficient (R) of 0.256 and weighted average of 64.6%. Similarly, the statistical analysis conducted on geographies consisting of 150,205,158 people shows a weak positive correlation between the proportion of Immigrants from Belarus and percentage of population with at least college, 1 year or more education in the United States with a correlation coefficient (R) of 0.222 and weighted average of 64.1%, a difference of 0.74%.
College, 1 year or more Correlation Summary
| Measurement | Immigrants from Bulgaria | Immigrants from Belarus |
| Minimum | 46.2% | 34.0% |
| Maximum | 100.0% | 97.2% |
| Range | 53.8% | 63.1% |
| Mean | 68.3% | 64.3% |
| Median | 68.0% | 63.6% |
| Interquartile 25% (IQ1) | 59.6% | 54.4% |
| Interquartile 75% (IQ3) | 79.1% | 72.8% |
| Interquartile Range (IQR) | 19.5% | 18.4% |
| Standard Deviation (Sample) | 14.5% | 13.1% |
| Standard Deviation (Population) | 14.1% | 13.0% |
Demographics Similar to Immigrants from Bulgaria and Immigrants from Belarus by College, 1 year or more
In terms of college, 1 year or more, the demographic groups most similar to Immigrants from Bulgaria are Australian (64.6%, a difference of 0.030%), Bhutanese (64.6%, a difference of 0.040%), New Zealander (64.6%, a difference of 0.040%), Immigrants from Lithuania (64.6%, a difference of 0.050%), and Immigrants from Norway (64.7%, a difference of 0.21%). Similarly, the demographic groups most similar to Immigrants from Belarus are Immigrants from Czechoslovakia (64.1%, a difference of 0.030%), South African (64.1%, a difference of 0.040%), Zimbabwean (64.2%, a difference of 0.12%), Asian (64.2%, a difference of 0.15%), and Immigrants from Netherlands (64.2%, a difference of 0.17%).
| Demographics | Rating | Rank | College, 1 year or more |
| Mongolians | 99.9 /100 | #41 | Exceptional 64.8% |
| Immigrants | Latvia | 99.9 /100 | #42 | Exceptional 64.8% |
| Immigrants | Russia | 99.9 /100 | #43 | Exceptional 64.7% |
| Immigrants | Norway | 99.9 /100 | #44 | Exceptional 64.7% |
| Immigrants | Lithuania | 99.9 /100 | #45 | Exceptional 64.6% |
| Bhutanese | 99.9 /100 | #46 | Exceptional 64.6% |
| Australians | 99.9 /100 | #47 | Exceptional 64.6% |
| Immigrants | Bulgaria | 99.9 /100 | #48 | Exceptional 64.6% |
| New Zealanders | 99.9 /100 | #49 | Exceptional 64.6% |
| Immigrants | Austria | 99.8 /100 | #50 | Exceptional 64.4% |
| Immigrants | Malaysia | 99.8 /100 | #51 | Exceptional 64.3% |
| Immigrants | Netherlands | 99.8 /100 | #52 | Exceptional 64.2% |
| Asians | 99.8 /100 | #53 | Exceptional 64.2% |
| Zimbabweans | 99.8 /100 | #54 | Exceptional 64.2% |
| Immigrants | Belarus | 99.7 /100 | #55 | Exceptional 64.1% |
| Immigrants | Czechoslovakia | 99.7 /100 | #56 | Exceptional 64.1% |
| South Africans | 99.7 /100 | #57 | Exceptional 64.1% |
| Immigrants | Asia | 99.7 /100 | #58 | Exceptional 64.0% |
| Immigrants | Serbia | 99.6 /100 | #59 | Exceptional 63.8% |
| Immigrants | Kazakhstan | 99.5 /100 | #60 | Exceptional 63.6% |
| Bolivians | 99.5 /100 | #61 | Exceptional 63.5% |