Serbian vs Immigrants from Guyana Unemployment Among Ages 60 to 64 years
COMPARE
Serbian
Immigrants from Guyana
Unemployment Among Ages 60 to 64 years
Unemployment Among Ages 60 to 64 years Comparison
Serbians
Immigrants from Guyana
4.7%
UNEMPLOYMENT AMONG AGES 60 TO 64 YEARS
98.2/ 100
METRIC RATING
95th/ 347
METRIC RANK
5.4%
UNEMPLOYMENT AMONG AGES 60 TO 64 YEARS
0.0/ 100
METRIC RATING
307th/ 347
METRIC RANK
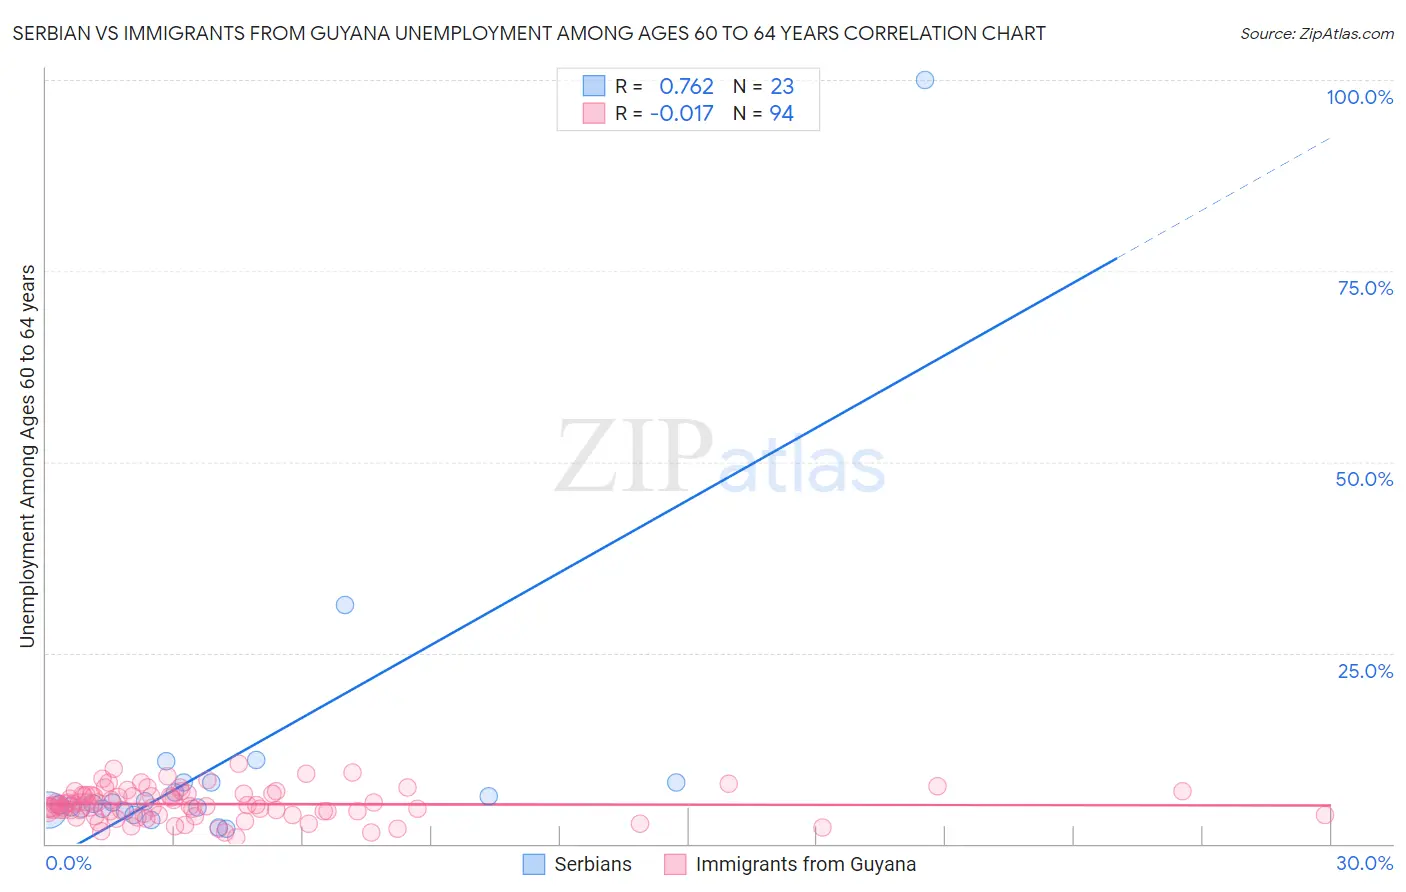
Serbian vs Immigrants from Guyana Unemployment Among Ages 60 to 64 years Correlation Chart
The statistical analysis conducted on geographies consisting of 248,507,715 people shows a strong positive correlation between the proportion of Serbians and unemployment rate among population between the ages 60 and 64 in the United States with a correlation coefficient (R) of 0.762 and weighted average of 4.7%. Similarly, the statistical analysis conducted on geographies consisting of 174,358,998 people shows no correlation between the proportion of Immigrants from Guyana and unemployment rate among population between the ages 60 and 64 in the United States with a correlation coefficient (R) of -0.017 and weighted average of 5.4%, a difference of 15.4%.
Unemployment Among Ages 60 to 64 years Correlation Summary
| Measurement | Serbian | Immigrants from Guyana |
| Minimum | 1.9% | 0.90% |
| Maximum | 100.0% | 10.5% |
| Range | 98.1% | 9.6% |
| Mean | 10.9% | 5.2% |
| Median | 5.2% | 5.0% |
| Interquartile 25% (IQ1) | 4.5% | 3.9% |
| Interquartile 75% (IQ3) | 8.0% | 6.4% |
| Interquartile Range (IQR) | 3.6% | 2.5% |
| Standard Deviation (Sample) | 20.3% | 2.0% |
| Standard Deviation (Population) | 19.8% | 2.0% |
Similar Demographics by Unemployment Among Ages 60 to 64 years
Demographics Similar to Serbians by Unemployment Among Ages 60 to 64 years
In terms of unemployment among ages 60 to 64 years, the demographic groups most similar to Serbians are Polish (4.7%, a difference of 0.010%), Immigrants from Saudi Arabia (4.7%, a difference of 0.080%), Immigrants from Kuwait (4.7%, a difference of 0.080%), Romanian (4.7%, a difference of 0.10%), and Immigrants from Albania (4.7%, a difference of 0.10%).
| Demographics | Rating | Rank | Unemployment Among Ages 60 to 64 years |
| Immigrants | Bulgaria | 98.7 /100 | #88 | Exceptional 4.7% |
| Immigrants | Northern Africa | 98.7 /100 | #89 | Exceptional 4.7% |
| Immigrants | Liberia | 98.7 /100 | #90 | Exceptional 4.7% |
| Immigrants | Uganda | 98.4 /100 | #91 | Exceptional 4.7% |
| Romanians | 98.4 /100 | #92 | Exceptional 4.7% |
| Immigrants | Saudi Arabia | 98.3 /100 | #93 | Exceptional 4.7% |
| Immigrants | Kuwait | 98.3 /100 | #94 | Exceptional 4.7% |
| Serbians | 98.2 /100 | #95 | Exceptional 4.7% |
| Poles | 98.1 /100 | #96 | Exceptional 4.7% |
| Immigrants | Albania | 98.0 /100 | #97 | Exceptional 4.7% |
| Somalis | 98.0 /100 | #98 | Exceptional 4.7% |
| Egyptians | 98.0 /100 | #99 | Exceptional 4.7% |
| Portuguese | 97.9 /100 | #100 | Exceptional 4.7% |
| Malaysians | 97.9 /100 | #101 | Exceptional 4.7% |
| Immigrants | Canada | 97.8 /100 | #102 | Exceptional 4.7% |
Demographics Similar to Immigrants from Guyana by Unemployment Among Ages 60 to 64 years
In terms of unemployment among ages 60 to 64 years, the demographic groups most similar to Immigrants from Guyana are Spanish American Indian (5.4%, a difference of 0.020%), Soviet Union (5.4%, a difference of 0.020%), Immigrants from Dominica (5.4%, a difference of 0.17%), Cypriot (5.4%, a difference of 0.24%), and Immigrants from Mexico (5.4%, a difference of 0.26%).
| Demographics | Rating | Rank | Unemployment Among Ages 60 to 64 years |
| Immigrants | Barbados | 0.0 /100 | #300 | Tragic 5.4% |
| Immigrants | Jamaica | 0.0 /100 | #301 | Tragic 5.4% |
| Barbadians | 0.0 /100 | #302 | Tragic 5.4% |
| Bahamians | 0.0 /100 | #303 | Tragic 5.4% |
| Immigrants | Mexico | 0.0 /100 | #304 | Tragic 5.4% |
| Cypriots | 0.0 /100 | #305 | Tragic 5.4% |
| Immigrants | Dominica | 0.0 /100 | #306 | Tragic 5.4% |
| Immigrants | Guyana | 0.0 /100 | #307 | Tragic 5.4% |
| Spanish American Indians | 0.0 /100 | #308 | Tragic 5.4% |
| Soviet Union | 0.0 /100 | #309 | Tragic 5.4% |
| British West Indians | 0.0 /100 | #310 | Tragic 5.5% |
| U.S. Virgin Islanders | 0.0 /100 | #311 | Tragic 5.5% |
| Immigrants | West Indies | 0.0 /100 | #312 | Tragic 5.5% |
| Belizeans | 0.0 /100 | #313 | Tragic 5.5% |
| Guyanese | 0.0 /100 | #314 | Tragic 5.5% |