Guatemalan vs Immigrants from Guyana College, Under 1 year
COMPARE
Guatemalan
Immigrants from Guyana
College, Under 1 year
College, Under 1 year Comparison
Guatemalans
Immigrants from Guyana
56.8%
COLLEGE, UNDER 1 YEAR
0.0/ 100
METRIC RATING
320th/ 347
METRIC RANK
58.5%
COLLEGE, UNDER 1 YEAR
0.0/ 100
METRIC RATING
300th/ 347
METRIC RANK
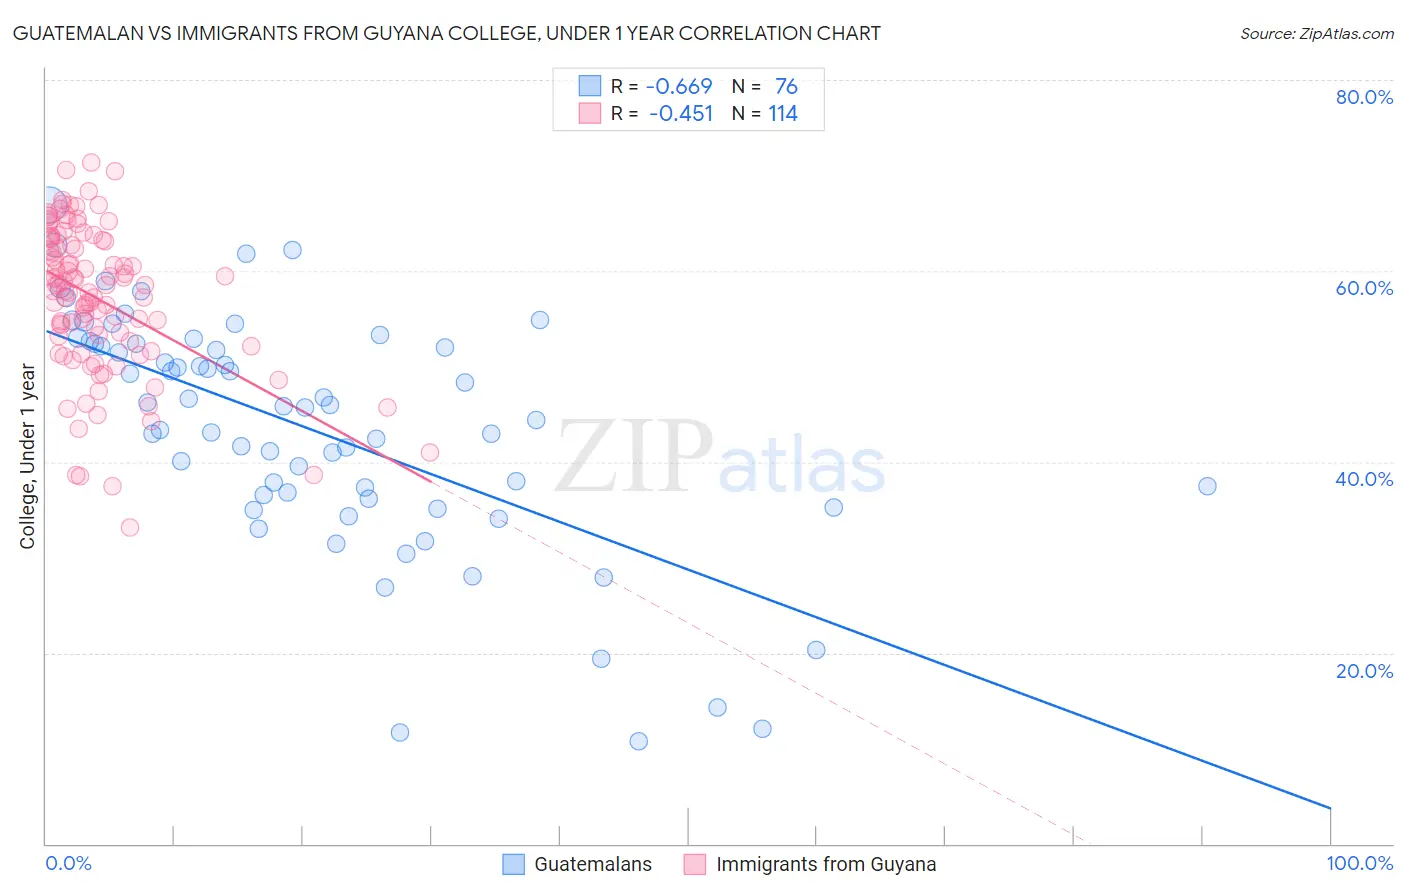
Guatemalan vs Immigrants from Guyana College, Under 1 year Correlation Chart
The statistical analysis conducted on geographies consisting of 409,563,856 people shows a significant negative correlation between the proportion of Guatemalans and percentage of population with at least college, under 1 year education in the United States with a correlation coefficient (R) of -0.669 and weighted average of 56.8%. Similarly, the statistical analysis conducted on geographies consisting of 183,735,121 people shows a moderate negative correlation between the proportion of Immigrants from Guyana and percentage of population with at least college, under 1 year education in the United States with a correlation coefficient (R) of -0.451 and weighted average of 58.5%, a difference of 3.0%.
College, Under 1 year Correlation Summary
| Measurement | Guatemalan | Immigrants from Guyana |
| Minimum | 10.7% | 33.1% |
| Maximum | 66.9% | 71.3% |
| Range | 56.2% | 38.3% |
| Mean | 43.4% | 57.1% |
| Median | 45.8% | 58.5% |
| Interquartile 25% (IQ1) | 36.4% | 52.6% |
| Interquartile 75% (IQ3) | 52.4% | 63.2% |
| Interquartile Range (IQR) | 16.0% | 10.6% |
| Standard Deviation (Sample) | 12.4% | 7.8% |
| Standard Deviation (Population) | 12.3% | 7.8% |
Demographics Similar to Guatemalans and Immigrants from Guyana by College, Under 1 year
In terms of college, under 1 year, the demographic groups most similar to Guatemalans are Puerto Rican (56.8%, a difference of 0.060%), Immigrants from Haiti (56.9%, a difference of 0.27%), Hispanic or Latino (57.0%, a difference of 0.38%), Menominee (57.0%, a difference of 0.42%), and Honduran (57.1%, a difference of 0.48%). Similarly, the demographic groups most similar to Immigrants from Guyana are Mexican American Indian (58.1%, a difference of 0.62%), Apache (58.0%, a difference of 0.81%), Immigrants from Dominica (57.9%, a difference of 1.1%), Kiowa (57.8%, a difference of 1.1%), and Haitian (57.8%, a difference of 1.2%).
| Demographics | Rating | Rank | College, Under 1 year |
| Immigrants | Guyana | 0.0 /100 | #300 | Tragic 58.5% |
| Mexican American Indians | 0.0 /100 | #301 | Tragic 58.1% |
| Apache | 0.0 /100 | #302 | Tragic 58.0% |
| Immigrants | Dominica | 0.0 /100 | #303 | Tragic 57.9% |
| Kiowa | 0.0 /100 | #304 | Tragic 57.8% |
| Haitians | 0.0 /100 | #305 | Tragic 57.8% |
| Immigrants | Portugal | 0.0 /100 | #306 | Tragic 57.7% |
| Fijians | 0.0 /100 | #307 | Tragic 57.7% |
| Central Americans | 0.0 /100 | #308 | Tragic 57.7% |
| Immigrants | Nicaragua | 0.0 /100 | #309 | Tragic 57.6% |
| Pueblo | 0.0 /100 | #310 | Tragic 57.4% |
| Cajuns | 0.0 /100 | #311 | Tragic 57.3% |
| Salvadorans | 0.0 /100 | #312 | Tragic 57.3% |
| Dutch West Indians | 0.0 /100 | #313 | Tragic 57.2% |
| Hopi | 0.0 /100 | #314 | Tragic 57.1% |
| Hondurans | 0.0 /100 | #315 | Tragic 57.1% |
| Menominee | 0.0 /100 | #316 | Tragic 57.0% |
| Hispanics or Latinos | 0.0 /100 | #317 | Tragic 57.0% |
| Immigrants | Haiti | 0.0 /100 | #318 | Tragic 56.9% |
| Puerto Ricans | 0.0 /100 | #319 | Tragic 56.8% |
| Guatemalans | 0.0 /100 | #320 | Tragic 56.8% |