Serbian vs Immigrants from Guyana Female Unemployment
COMPARE
Serbian
Immigrants from Guyana
Female Unemployment
Female Unemployment Comparison
Serbians
Immigrants from Guyana
4.9%
FEMALE UNEMPLOYMENT
99.0/ 100
METRIC RATING
56th/ 347
METRIC RANK
6.7%
FEMALE UNEMPLOYMENT
0.0/ 100
METRIC RATING
329th/ 347
METRIC RANK
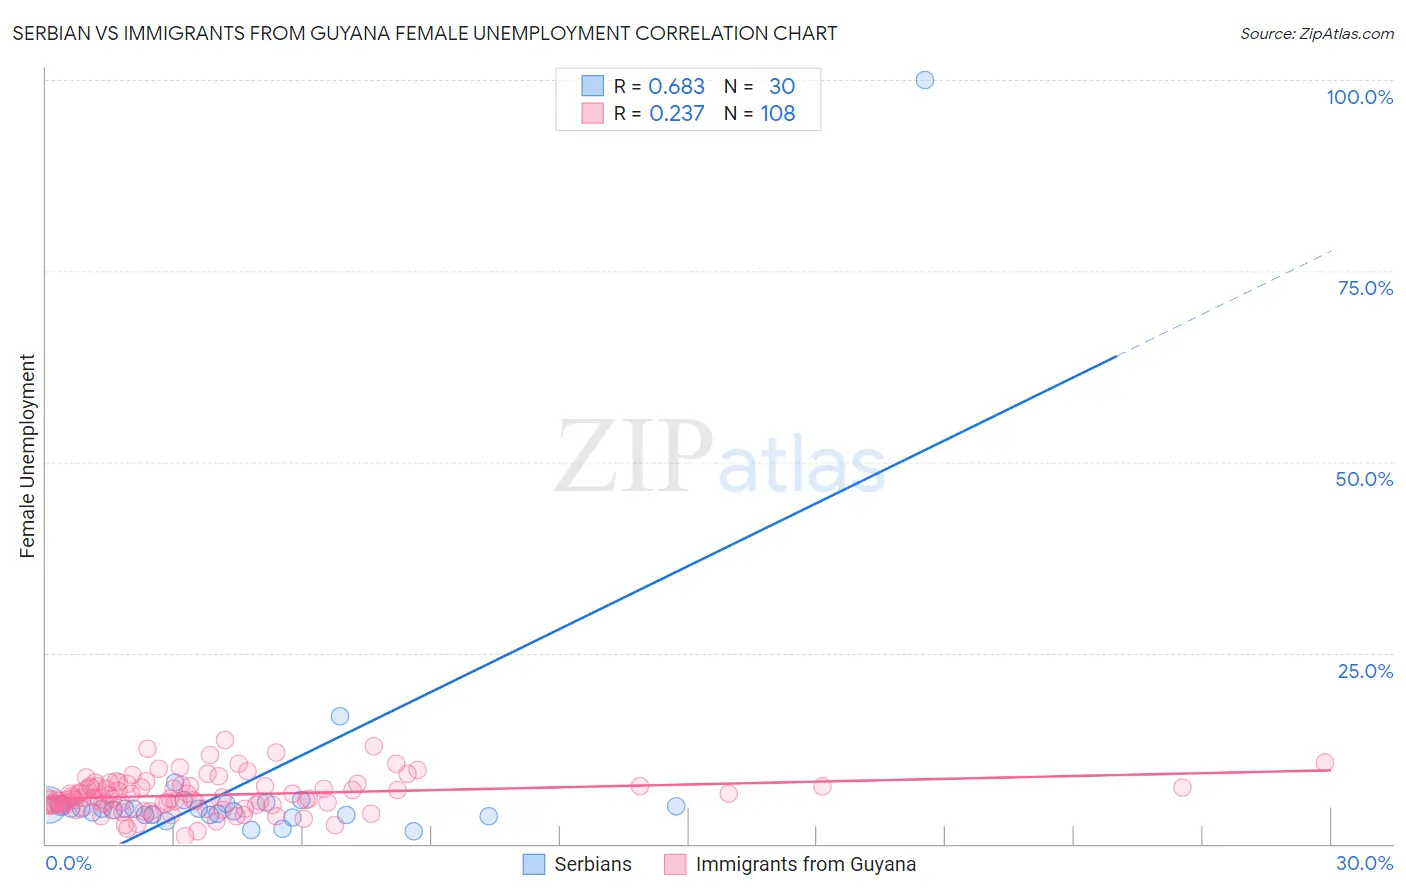
Serbian vs Immigrants from Guyana Female Unemployment Correlation Chart
The statistical analysis conducted on geographies consisting of 266,650,346 people shows a significant positive correlation between the proportion of Serbians and unemploymnet rate among females in the United States with a correlation coefficient (R) of 0.683 and weighted average of 4.9%. Similarly, the statistical analysis conducted on geographies consisting of 183,445,412 people shows a weak positive correlation between the proportion of Immigrants from Guyana and unemploymnet rate among females in the United States with a correlation coefficient (R) of 0.237 and weighted average of 6.7%, a difference of 36.5%.
Female Unemployment Correlation Summary
| Measurement | Serbian | Immigrants from Guyana |
| Minimum | 1.7% | 1.0% |
| Maximum | 100.0% | 13.6% |
| Range | 98.3% | 12.6% |
| Mean | 7.9% | 6.4% |
| Median | 4.6% | 6.0% |
| Interquartile 25% (IQ1) | 3.7% | 5.1% |
| Interquartile 75% (IQ3) | 5.1% | 7.5% |
| Interquartile Range (IQR) | 1.4% | 2.4% |
| Standard Deviation (Sample) | 17.6% | 2.4% |
| Standard Deviation (Population) | 17.3% | 2.4% |
Similar Demographics by Female Unemployment
Demographics Similar to Serbians by Female Unemployment
In terms of female unemployment, the demographic groups most similar to Serbians are Immigrants from Moldova (4.9%, a difference of 0.020%), Immigrants from Zimbabwe (4.9%, a difference of 0.030%), White/Caucasian (4.9%, a difference of 0.090%), Slavic (4.9%, a difference of 0.12%), and Cambodian (4.9%, a difference of 0.14%).
| Demographics | Rating | Rank | Female Unemployment |
| Australians | 99.2 /100 | #49 | Exceptional 4.9% |
| Immigrants | Cuba | 99.1 /100 | #50 | Exceptional 4.9% |
| Cambodians | 99.1 /100 | #51 | Exceptional 4.9% |
| Slavs | 99.1 /100 | #52 | Exceptional 4.9% |
| Whites/Caucasians | 99.0 /100 | #53 | Exceptional 4.9% |
| Immigrants | Zimbabwe | 99.0 /100 | #54 | Exceptional 4.9% |
| Immigrants | Moldova | 99.0 /100 | #55 | Exceptional 4.9% |
| Serbians | 99.0 /100 | #56 | Exceptional 4.9% |
| Icelanders | 98.8 /100 | #57 | Exceptional 4.9% |
| Immigrants | Lithuania | 98.8 /100 | #58 | Exceptional 4.9% |
| Bhutanese | 98.7 /100 | #59 | Exceptional 4.9% |
| Immigrants | Scotland | 98.6 /100 | #60 | Exceptional 4.9% |
| Immigrants | Canada | 98.6 /100 | #61 | Exceptional 4.9% |
| Immigrants | Nepal | 98.6 /100 | #62 | Exceptional 4.9% |
| Immigrants | Belgium | 98.5 /100 | #63 | Exceptional 4.9% |
Demographics Similar to Immigrants from Guyana by Female Unemployment
In terms of female unemployment, the demographic groups most similar to Immigrants from Guyana are Guyanese (6.7%, a difference of 0.37%), Yakama (6.7%, a difference of 0.57%), Alaska Native (6.6%, a difference of 0.80%), Native/Alaskan (6.6%, a difference of 0.89%), and Apache (6.6%, a difference of 1.5%).
| Demographics | Rating | Rank | Female Unemployment |
| Vietnamese | 0.0 /100 | #322 | Tragic 6.5% |
| Immigrants | Belize | 0.0 /100 | #323 | Tragic 6.5% |
| Cheyenne | 0.0 /100 | #324 | Tragic 6.6% |
| Apache | 0.0 /100 | #325 | Tragic 6.6% |
| Natives/Alaskans | 0.0 /100 | #326 | Tragic 6.6% |
| Alaska Natives | 0.0 /100 | #327 | Tragic 6.6% |
| Guyanese | 0.0 /100 | #328 | Tragic 6.7% |
| Immigrants | Guyana | 0.0 /100 | #329 | Tragic 6.7% |
| Yakama | 0.0 /100 | #330 | Tragic 6.7% |
| Paiute | 0.0 /100 | #331 | Tragic 6.8% |
| Sioux | 0.0 /100 | #332 | Tragic 7.0% |
| Menominee | 0.0 /100 | #333 | Tragic 7.0% |
| Immigrants | Armenia | 0.0 /100 | #334 | Tragic 7.1% |
| Dominicans | 0.0 /100 | #335 | Tragic 7.2% |
| Immigrants | Dominican Republic | 0.0 /100 | #336 | Tragic 7.2% |