Immigrants from St. Vincent and the Grenadines vs Immigrants from Guyana College, Under 1 year
COMPARE
Immigrants from St. Vincent and the Grenadines
Immigrants from Guyana
College, Under 1 year
College, Under 1 year Comparison
Immigrants from St. Vincent and the Grenadines
Immigrants from Guyana
59.6%
COLLEGE, UNDER 1 YEAR
0.0/ 100
METRIC RATING
284th/ 347
METRIC RANK
58.5%
COLLEGE, UNDER 1 YEAR
0.0/ 100
METRIC RATING
300th/ 347
METRIC RANK
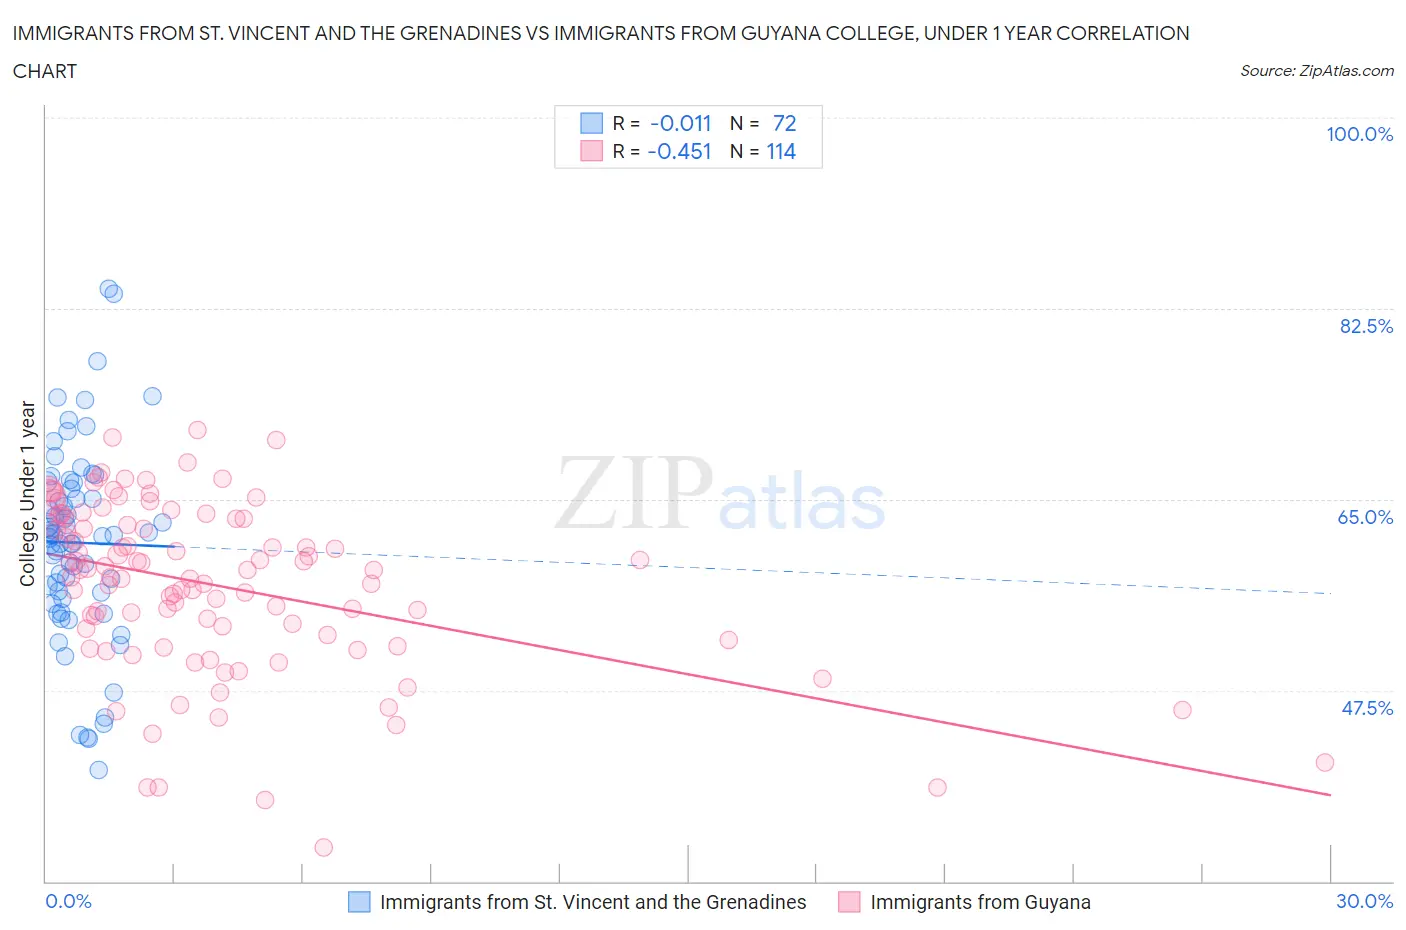
Immigrants from St. Vincent and the Grenadines vs Immigrants from Guyana College, Under 1 year Correlation Chart
The statistical analysis conducted on geographies consisting of 56,185,220 people shows no correlation between the proportion of Immigrants from St. Vincent and the Grenadines and percentage of population with at least college, under 1 year education in the United States with a correlation coefficient (R) of -0.011 and weighted average of 59.6%. Similarly, the statistical analysis conducted on geographies consisting of 183,735,121 people shows a moderate negative correlation between the proportion of Immigrants from Guyana and percentage of population with at least college, under 1 year education in the United States with a correlation coefficient (R) of -0.451 and weighted average of 58.5%, a difference of 2.0%.
College, Under 1 year Correlation Summary
| Measurement | Immigrants from St. Vincent and the Grenadines | Immigrants from Guyana |
| Minimum | 40.2% | 33.1% |
| Maximum | 84.3% | 71.3% |
| Range | 44.1% | 38.3% |
| Mean | 61.0% | 57.1% |
| Median | 61.7% | 58.5% |
| Interquartile 25% (IQ1) | 56.1% | 52.6% |
| Interquartile 75% (IQ3) | 66.3% | 63.2% |
| Interquartile Range (IQR) | 10.1% | 10.6% |
| Standard Deviation (Sample) | 8.9% | 7.8% |
| Standard Deviation (Population) | 8.8% | 7.8% |
Demographics Similar to Immigrants from St. Vincent and the Grenadines and Immigrants from Guyana by College, Under 1 year
In terms of college, under 1 year, the demographic groups most similar to Immigrants from St. Vincent and the Grenadines are Paiute (59.6%, a difference of 0.010%), Immigrants from Jamaica (59.7%, a difference of 0.11%), British West Indian (59.5%, a difference of 0.15%), Sioux (59.4%, a difference of 0.32%), and Black/African American (59.4%, a difference of 0.42%). Similarly, the demographic groups most similar to Immigrants from Guyana are Cuban (58.6%, a difference of 0.26%), Immigrants from Ecuador (58.7%, a difference of 0.39%), Mexican American Indian (58.1%, a difference of 0.62%), Apache (58.0%, a difference of 0.81%), and Guyanese (59.0%, a difference of 0.89%).
| Demographics | Rating | Rank | College, Under 1 year |
| Belizeans | 0.1 /100 | #282 | Tragic 60.1% |
| Immigrants | Jamaica | 0.0 /100 | #283 | Tragic 59.7% |
| Immigrants | St. Vincent and the Grenadines | 0.0 /100 | #284 | Tragic 59.6% |
| Paiute | 0.0 /100 | #285 | Tragic 59.6% |
| British West Indians | 0.0 /100 | #286 | Tragic 59.5% |
| Sioux | 0.0 /100 | #287 | Tragic 59.4% |
| Blacks/African Americans | 0.0 /100 | #288 | Tragic 59.4% |
| Choctaw | 0.0 /100 | #289 | Tragic 59.3% |
| Ecuadorians | 0.0 /100 | #290 | Tragic 59.3% |
| Creek | 0.0 /100 | #291 | Tragic 59.3% |
| Nicaraguans | 0.0 /100 | #292 | Tragic 59.2% |
| Seminole | 0.0 /100 | #293 | Tragic 59.1% |
| Immigrants | Belize | 0.0 /100 | #294 | Tragic 59.1% |
| Immigrants | Grenada | 0.0 /100 | #295 | Tragic 59.1% |
| Central American Indians | 0.0 /100 | #296 | Tragic 59.0% |
| Guyanese | 0.0 /100 | #297 | Tragic 59.0% |
| Immigrants | Ecuador | 0.0 /100 | #298 | Tragic 58.7% |
| Cubans | 0.0 /100 | #299 | Tragic 58.6% |
| Immigrants | Guyana | 0.0 /100 | #300 | Tragic 58.5% |
| Mexican American Indians | 0.0 /100 | #301 | Tragic 58.1% |
| Apache | 0.0 /100 | #302 | Tragic 58.0% |