Scottish vs Immigrants from Grenada Single Father Poverty
COMPARE
Scottish
Immigrants from Grenada
Single Father Poverty
Single Father Poverty Comparison
Scottish
Immigrants from Grenada
17.7%
SINGLE FATHER POVERTY
0.0/ 100
METRIC RATING
280th/ 347
METRIC RANK
16.9%
SINGLE FATHER POVERTY
3.7/ 100
METRIC RATING
232nd/ 347
METRIC RANK
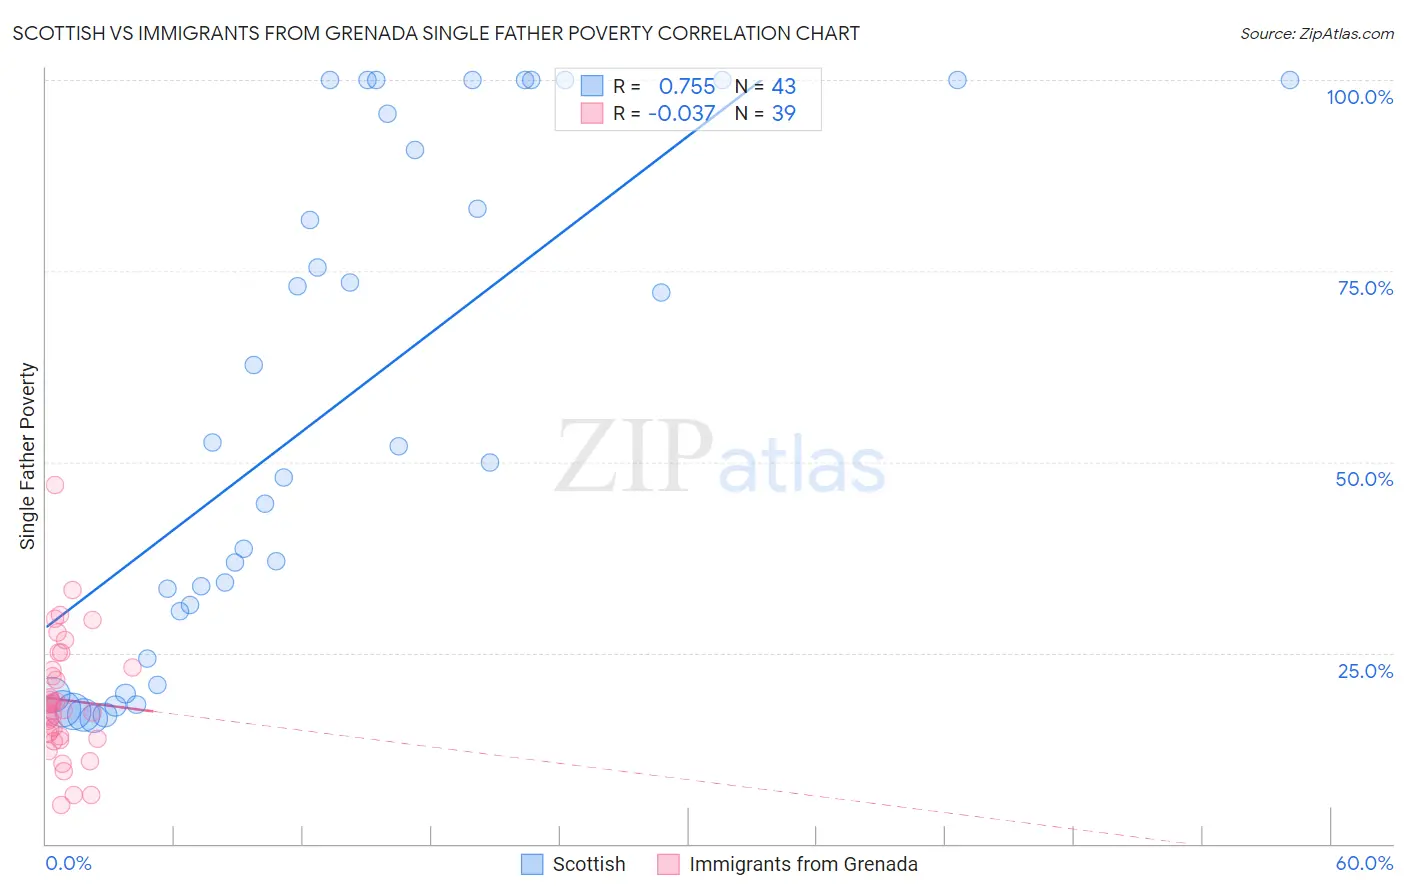
Scottish vs Immigrants from Grenada Single Father Poverty Correlation Chart
The statistical analysis conducted on geographies consisting of 405,098,352 people shows a strong positive correlation between the proportion of Scottish and poverty level among single fathers in the United States with a correlation coefficient (R) of 0.755 and weighted average of 17.7%. Similarly, the statistical analysis conducted on geographies consisting of 62,119,741 people shows no correlation between the proportion of Immigrants from Grenada and poverty level among single fathers in the United States with a correlation coefficient (R) of -0.037 and weighted average of 16.9%, a difference of 5.1%.
Single Father Poverty Correlation Summary
| Measurement | Scottish | Immigrants from Grenada |
| Minimum | 16.4% | 5.0% |
| Maximum | 100.0% | 47.0% |
| Range | 83.6% | 42.0% |
| Mean | 56.6% | 18.9% |
| Median | 50.0% | 17.6% |
| Interquartile 25% (IQ1) | 24.3% | 13.7% |
| Interquartile 75% (IQ3) | 95.6% | 23.1% |
| Interquartile Range (IQR) | 71.3% | 9.4% |
| Standard Deviation (Sample) | 32.4% | 8.2% |
| Standard Deviation (Population) | 32.1% | 8.1% |
Similar Demographics by Single Father Poverty
Demographics Similar to Scottish by Single Father Poverty
In terms of single father poverty, the demographic groups most similar to Scottish are Iroquois (17.7%, a difference of 0.050%), German (17.7%, a difference of 0.19%), Lebanese (17.7%, a difference of 0.20%), English (17.8%, a difference of 0.32%), and Dutch (17.8%, a difference of 0.32%).
| Demographics | Rating | Rank | Single Father Poverty |
| Italians | 0.1 /100 | #273 | Tragic 17.5% |
| Macedonians | 0.1 /100 | #274 | Tragic 17.7% |
| British West Indians | 0.0 /100 | #275 | Tragic 17.7% |
| German Russians | 0.0 /100 | #276 | Tragic 17.7% |
| Lebanese | 0.0 /100 | #277 | Tragic 17.7% |
| Germans | 0.0 /100 | #278 | Tragic 17.7% |
| Iroquois | 0.0 /100 | #279 | Tragic 17.7% |
| Scottish | 0.0 /100 | #280 | Tragic 17.7% |
| English | 0.0 /100 | #281 | Tragic 17.8% |
| Dutch | 0.0 /100 | #282 | Tragic 17.8% |
| Alsatians | 0.0 /100 | #283 | Tragic 17.8% |
| Welsh | 0.0 /100 | #284 | Tragic 17.8% |
| Immigrants | Lebanon | 0.0 /100 | #285 | Tragic 17.9% |
| Immigrants | North Macedonia | 0.0 /100 | #286 | Tragic 17.9% |
| Carpatho Rusyns | 0.0 /100 | #287 | Tragic 18.0% |
Demographics Similar to Immigrants from Grenada by Single Father Poverty
In terms of single father poverty, the demographic groups most similar to Immigrants from Grenada are Spanish American (16.9%, a difference of 0.020%), Senegalese (16.9%, a difference of 0.14%), Marshallese (16.9%, a difference of 0.17%), Immigrants from Trinidad and Tobago (16.8%, a difference of 0.23%), and Israeli (16.8%, a difference of 0.26%).
| Demographics | Rating | Rank | Single Father Poverty |
| Menominee | 6.4 /100 | #225 | Tragic 16.8% |
| Hispanics or Latinos | 6.1 /100 | #226 | Tragic 16.8% |
| British | 5.6 /100 | #227 | Tragic 16.8% |
| Belgians | 5.3 /100 | #228 | Tragic 16.8% |
| Israelis | 4.6 /100 | #229 | Tragic 16.8% |
| Immigrants | Trinidad and Tobago | 4.5 /100 | #230 | Tragic 16.8% |
| Spanish Americans | 3.7 /100 | #231 | Tragic 16.9% |
| Immigrants | Grenada | 3.7 /100 | #232 | Tragic 16.9% |
| Senegalese | 3.2 /100 | #233 | Tragic 16.9% |
| Marshallese | 3.1 /100 | #234 | Tragic 16.9% |
| Immigrants | Western Europe | 2.9 /100 | #235 | Tragic 16.9% |
| Immigrants | Germany | 2.9 /100 | #236 | Tragic 16.9% |
| Sub-Saharan Africans | 2.9 /100 | #237 | Tragic 16.9% |
| Immigrants | Saudi Arabia | 2.7 /100 | #238 | Tragic 16.9% |
| Bermudans | 2.6 /100 | #239 | Tragic 16.9% |