Scottish vs Immigrants from Iraq College, 1 year or more
COMPARE
Scottish
Immigrants from Iraq
College, 1 year or more
College, 1 year or more Comparison
Scottish
Immigrants from Iraq
60.5%
COLLEGE, 1 YEAR OR MORE
80.2/ 100
METRIC RATING
146th/ 347
METRIC RANK
60.0%
COLLEGE, 1 YEAR OR MORE
67.0/ 100
METRIC RATING
159th/ 347
METRIC RANK
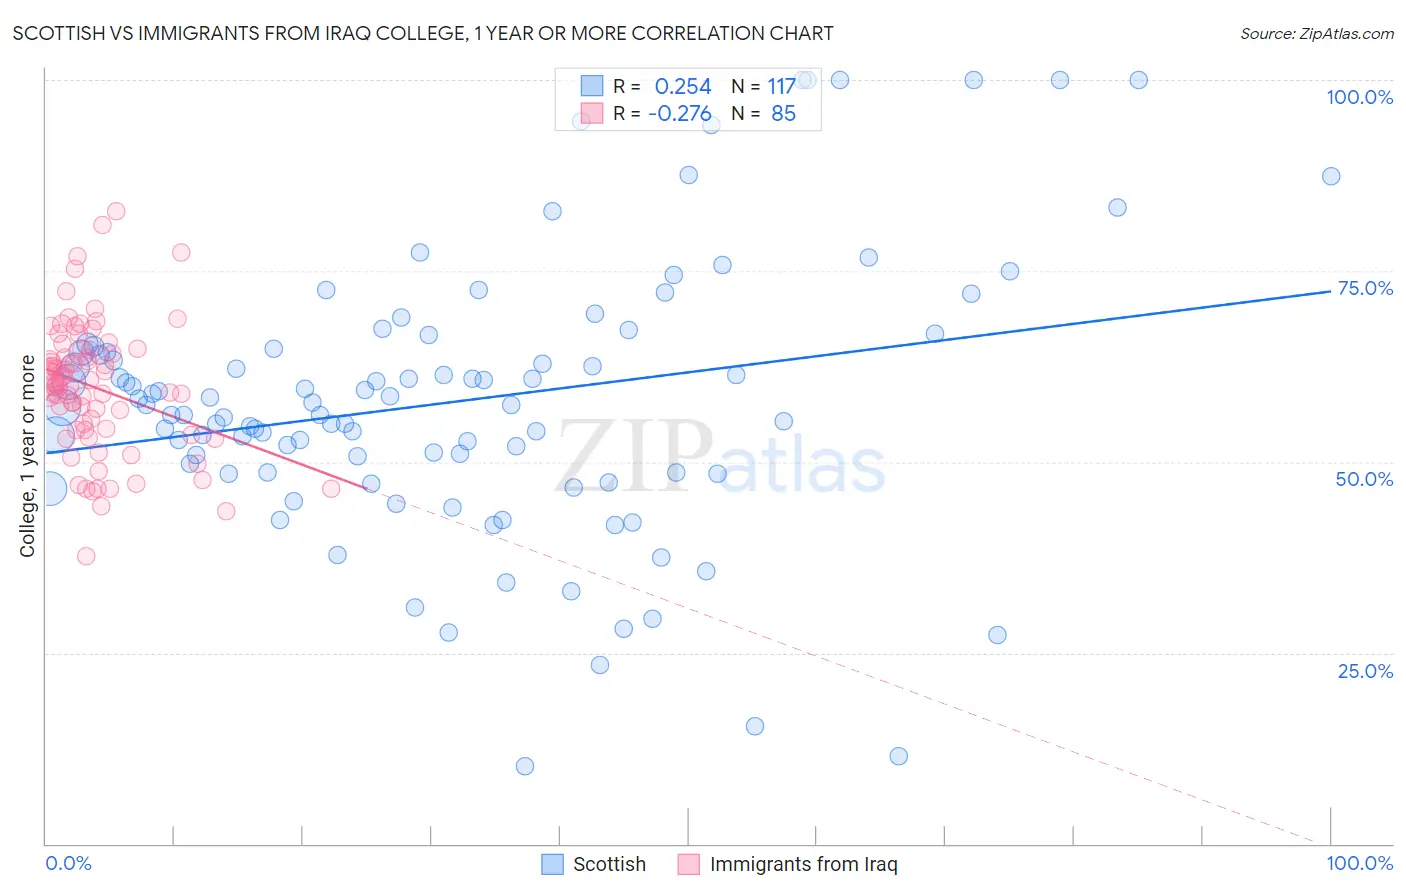
Scottish vs Immigrants from Iraq College, 1 year or more Correlation Chart
The statistical analysis conducted on geographies consisting of 567,133,506 people shows a weak positive correlation between the proportion of Scottish and percentage of population with at least college, 1 year or more education in the United States with a correlation coefficient (R) of 0.254 and weighted average of 60.5%. Similarly, the statistical analysis conducted on geographies consisting of 194,780,026 people shows a weak negative correlation between the proportion of Immigrants from Iraq and percentage of population with at least college, 1 year or more education in the United States with a correlation coefficient (R) of -0.276 and weighted average of 60.0%, a difference of 0.91%.
College, 1 year or more Correlation Summary
| Measurement | Scottish | Immigrants from Iraq |
| Minimum | 10.1% | 37.6% |
| Maximum | 100.0% | 82.9% |
| Range | 89.9% | 45.3% |
| Mean | 57.9% | 59.7% |
| Median | 57.5% | 60.2% |
| Interquartile 25% (IQ1) | 48.7% | 54.1% |
| Interquartile 75% (IQ3) | 65.0% | 64.8% |
| Interquartile Range (IQR) | 16.3% | 10.6% |
| Standard Deviation (Sample) | 17.9% | 8.6% |
| Standard Deviation (Population) | 17.8% | 8.6% |
Demographics Similar to Scottish and Immigrants from Iraq by College, 1 year or more
In terms of college, 1 year or more, the demographic groups most similar to Scottish are Slavic (60.6%, a difference of 0.070%), Immigrants from Kenya (60.5%, a difference of 0.090%), Kenyan (60.5%, a difference of 0.10%), Brazilian (60.5%, a difference of 0.10%), and Czech (60.6%, a difference of 0.14%). Similarly, the demographic groups most similar to Immigrants from Iraq are English (60.0%, a difference of 0.010%), South American Indian (60.0%, a difference of 0.010%), Immigrants from Armenia (60.0%, a difference of 0.11%), Somali (59.9%, a difference of 0.15%), and Sudanese (60.2%, a difference of 0.37%).
| Demographics | Rating | Rank | College, 1 year or more |
| Poles | 82.8 /100 | #142 | Excellent 60.7% |
| Canadians | 82.7 /100 | #143 | Excellent 60.6% |
| Czechs | 81.9 /100 | #144 | Excellent 60.6% |
| Slavs | 81.1 /100 | #145 | Excellent 60.6% |
| Scottish | 80.2 /100 | #146 | Excellent 60.5% |
| Immigrants | Kenya | 79.1 /100 | #147 | Good 60.5% |
| Kenyans | 79.0 /100 | #148 | Good 60.5% |
| Brazilians | 79.0 /100 | #149 | Good 60.5% |
| Immigrants | Sudan | 77.8 /100 | #150 | Good 60.4% |
| Albanians | 77.8 /100 | #151 | Good 60.4% |
| Immigrants | Germany | 76.1 /100 | #152 | Good 60.3% |
| Sierra Leoneans | 74.1 /100 | #153 | Good 60.2% |
| Sudanese | 73.0 /100 | #154 | Good 60.2% |
| Moroccans | 72.9 /100 | #155 | Good 60.2% |
| Finns | 72.9 /100 | #156 | Good 60.2% |
| Immigrants | Armenia | 68.8 /100 | #157 | Good 60.0% |
| English | 67.2 /100 | #158 | Good 60.0% |
| Immigrants | Iraq | 67.0 /100 | #159 | Good 60.0% |
| South American Indians | 66.9 /100 | #160 | Good 60.0% |
| Somalis | 64.5 /100 | #161 | Good 59.9% |
| Koreans | 58.5 /100 | #162 | Average 59.7% |