Scottish vs Hmong College, 1 year or more
COMPARE
Scottish
Hmong
College, 1 year or more
College, 1 year or more Comparison
Scottish
Hmong
60.5%
COLLEGE, 1 YEAR OR MORE
80.2/ 100
METRIC RATING
146th/ 347
METRIC RANK
57.2%
COLLEGE, 1 YEAR OR MORE
5.4/ 100
METRIC RATING
224th/ 347
METRIC RANK
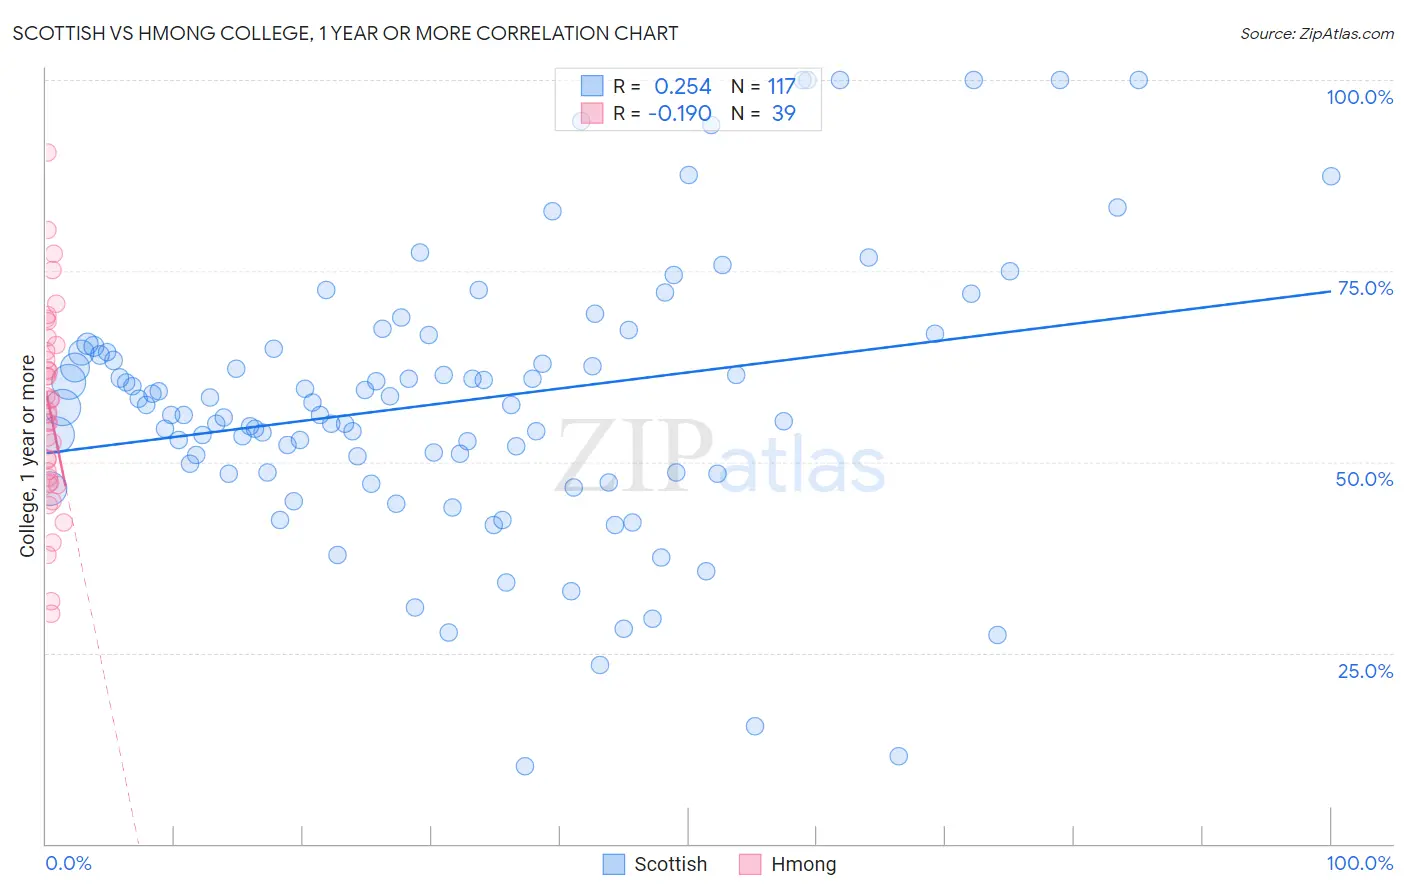
Scottish vs Hmong College, 1 year or more Correlation Chart
The statistical analysis conducted on geographies consisting of 567,133,506 people shows a weak positive correlation between the proportion of Scottish and percentage of population with at least college, 1 year or more education in the United States with a correlation coefficient (R) of 0.254 and weighted average of 60.5%. Similarly, the statistical analysis conducted on geographies consisting of 24,680,511 people shows a poor negative correlation between the proportion of Hmong and percentage of population with at least college, 1 year or more education in the United States with a correlation coefficient (R) of -0.190 and weighted average of 57.2%, a difference of 5.9%.
College, 1 year or more Correlation Summary
| Measurement | Scottish | Hmong |
| Minimum | 10.1% | 30.1% |
| Maximum | 100.0% | 90.4% |
| Range | 89.9% | 60.4% |
| Mean | 57.9% | 56.9% |
| Median | 57.5% | 56.5% |
| Interquartile 25% (IQ1) | 48.7% | 47.3% |
| Interquartile 75% (IQ3) | 65.0% | 65.3% |
| Interquartile Range (IQR) | 16.3% | 18.0% |
| Standard Deviation (Sample) | 17.9% | 13.1% |
| Standard Deviation (Population) | 17.8% | 12.9% |
Similar Demographics by College, 1 year or more
Demographics Similar to Scottish by College, 1 year or more
In terms of college, 1 year or more, the demographic groups most similar to Scottish are Slavic (60.6%, a difference of 0.070%), Immigrants from Kenya (60.5%, a difference of 0.090%), Kenyan (60.5%, a difference of 0.10%), Brazilian (60.5%, a difference of 0.10%), and Czech (60.6%, a difference of 0.14%).
| Demographics | Rating | Rank | College, 1 year or more |
| Immigrants | Eritrea | 84.3 /100 | #139 | Excellent 60.7% |
| Iraqis | 83.3 /100 | #140 | Excellent 60.7% |
| Immigrants | Afghanistan | 83.1 /100 | #141 | Excellent 60.7% |
| Poles | 82.8 /100 | #142 | Excellent 60.7% |
| Canadians | 82.7 /100 | #143 | Excellent 60.6% |
| Czechs | 81.9 /100 | #144 | Excellent 60.6% |
| Slavs | 81.1 /100 | #145 | Excellent 60.6% |
| Scottish | 80.2 /100 | #146 | Excellent 60.5% |
| Immigrants | Kenya | 79.1 /100 | #147 | Good 60.5% |
| Kenyans | 79.0 /100 | #148 | Good 60.5% |
| Brazilians | 79.0 /100 | #149 | Good 60.5% |
| Immigrants | Sudan | 77.8 /100 | #150 | Good 60.4% |
| Albanians | 77.8 /100 | #151 | Good 60.4% |
| Immigrants | Germany | 76.1 /100 | #152 | Good 60.3% |
| Sierra Leoneans | 74.1 /100 | #153 | Good 60.2% |
Demographics Similar to Hmong by College, 1 year or more
In terms of college, 1 year or more, the demographic groups most similar to Hmong are Portuguese (57.2%, a difference of 0.0%), Subsaharan African (57.3%, a difference of 0.17%), Vietnamese (57.0%, a difference of 0.21%), Immigrants from Western Africa (57.0%, a difference of 0.23%), and Immigrants (57.0%, a difference of 0.30%).
| Demographics | Rating | Rank | College, 1 year or more |
| Immigrants | Panama | 9.1 /100 | #217 | Tragic 57.6% |
| Native Hawaiians | 9.0 /100 | #218 | Tragic 57.6% |
| Whites/Caucasians | 8.7 /100 | #219 | Tragic 57.6% |
| Immigrants | Costa Rica | 8.0 /100 | #220 | Tragic 57.5% |
| Immigrants | Ghana | 7.7 /100 | #221 | Tragic 57.4% |
| Sub-Saharan Africans | 6.1 /100 | #222 | Tragic 57.3% |
| Portuguese | 5.4 /100 | #223 | Tragic 57.2% |
| Hmong | 5.4 /100 | #224 | Tragic 57.2% |
| Vietnamese | 4.7 /100 | #225 | Tragic 57.0% |
| Immigrants | Western Africa | 4.6 /100 | #226 | Tragic 57.0% |
| Immigrants | Immigrants | 4.4 /100 | #227 | Tragic 57.0% |
| Immigrants | Fiji | 4.0 /100 | #228 | Tragic 56.9% |
| Cree | 3.6 /100 | #229 | Tragic 56.8% |
| Liberians | 3.1 /100 | #230 | Tragic 56.7% |
| Immigrants | Burma/Myanmar | 2.7 /100 | #231 | Tragic 56.6% |