Scottish vs Immigrants from Belize College, Under 1 year
COMPARE
Scottish
Immigrants from Belize
College, Under 1 year
College, Under 1 year Comparison
Scottish
Immigrants from Belize
67.0%
COLLEGE, UNDER 1 YEAR
90.2/ 100
METRIC RATING
128th/ 347
METRIC RANK
59.1%
COLLEGE, UNDER 1 YEAR
0.0/ 100
METRIC RATING
294th/ 347
METRIC RANK
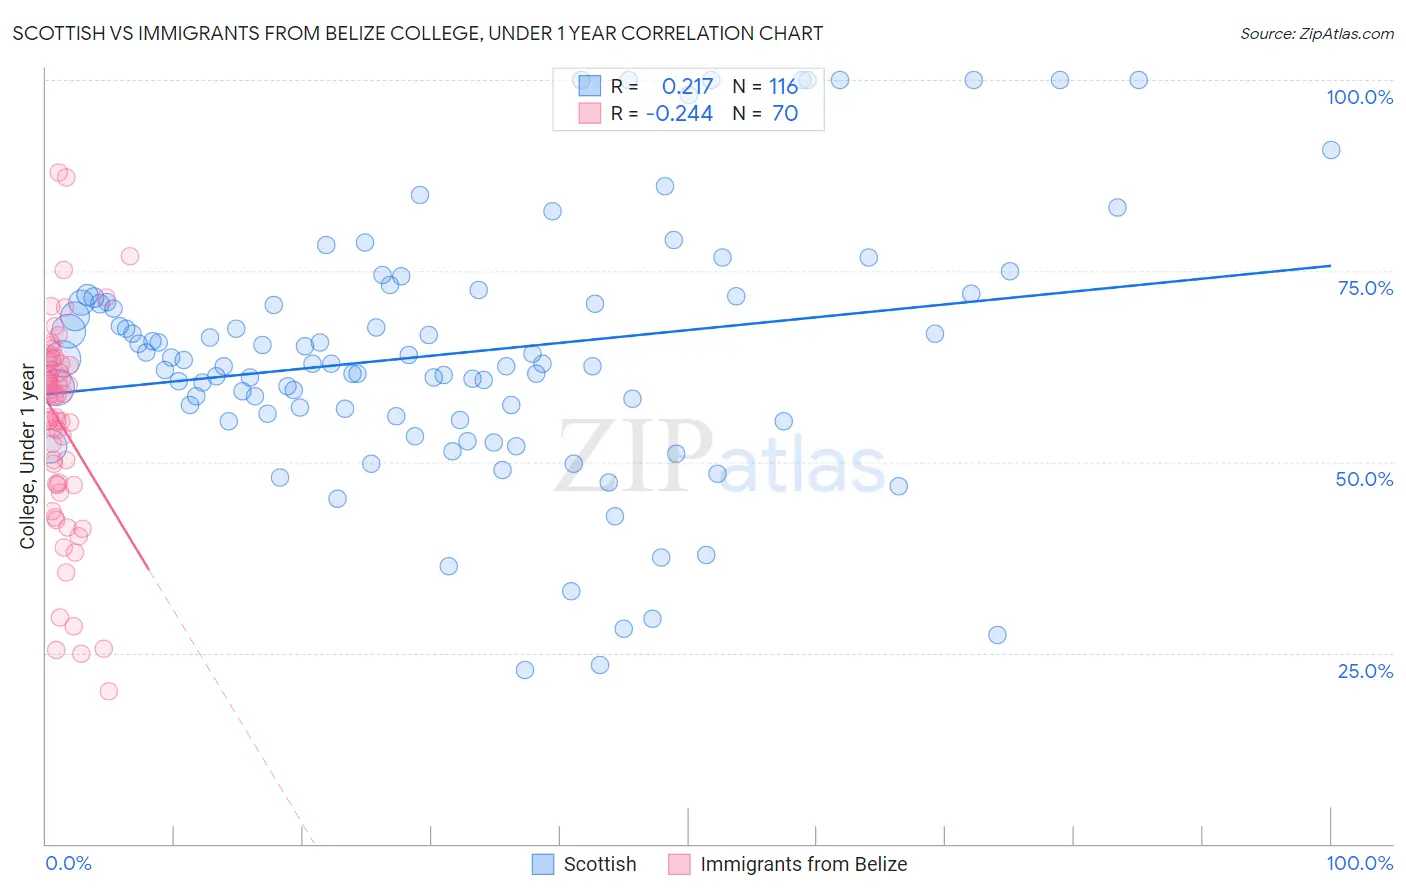
Scottish vs Immigrants from Belize College, Under 1 year Correlation Chart
The statistical analysis conducted on geographies consisting of 567,137,181 people shows a weak positive correlation between the proportion of Scottish and percentage of population with at least college, under 1 year education in the United States with a correlation coefficient (R) of 0.217 and weighted average of 67.0%. Similarly, the statistical analysis conducted on geographies consisting of 130,329,081 people shows a weak negative correlation between the proportion of Immigrants from Belize and percentage of population with at least college, under 1 year education in the United States with a correlation coefficient (R) of -0.244 and weighted average of 59.1%, a difference of 13.3%.
College, Under 1 year Correlation Summary
| Measurement | Scottish | Immigrants from Belize |
| Minimum | 22.8% | 19.9% |
| Maximum | 100.0% | 87.9% |
| Range | 77.2% | 68.0% |
| Mean | 64.2% | 54.9% |
| Median | 62.8% | 58.7% |
| Interquartile 25% (IQ1) | 56.1% | 47.0% |
| Interquartile 75% (IQ3) | 71.2% | 62.9% |
| Interquartile Range (IQR) | 15.1% | 15.9% |
| Standard Deviation (Sample) | 16.6% | 13.7% |
| Standard Deviation (Population) | 16.6% | 13.6% |
Similar Demographics by College, Under 1 year
Demographics Similar to Scottish by College, Under 1 year
In terms of college, under 1 year, the demographic groups most similar to Scottish are Czech (67.1%, a difference of 0.070%), Immigrants from Eastern Africa (67.0%, a difference of 0.080%), Alsatian (67.1%, a difference of 0.14%), Immigrants from Syria (66.9%, a difference of 0.14%), and Finnish (66.9%, a difference of 0.19%).
| Demographics | Rating | Rank | College, Under 1 year |
| Slovenes | 93.3 /100 | #121 | Exceptional 67.3% |
| Immigrants | Jordan | 92.8 /100 | #122 | Exceptional 67.3% |
| Immigrants | Northern Africa | 92.7 /100 | #123 | Exceptional 67.2% |
| Arabs | 92.6 /100 | #124 | Exceptional 67.2% |
| Italians | 91.8 /100 | #125 | Exceptional 67.2% |
| Alsatians | 91.3 /100 | #126 | Exceptional 67.1% |
| Czechs | 90.8 /100 | #127 | Exceptional 67.1% |
| Scottish | 90.2 /100 | #128 | Exceptional 67.0% |
| Immigrants | Eastern Africa | 89.5 /100 | #129 | Excellent 67.0% |
| Immigrants | Syria | 89.0 /100 | #130 | Excellent 66.9% |
| Finns | 88.6 /100 | #131 | Excellent 66.9% |
| Poles | 88.4 /100 | #132 | Excellent 66.9% |
| Immigrants | Brazil | 88.3 /100 | #133 | Excellent 66.9% |
| Iraqis | 88.0 /100 | #134 | Excellent 66.8% |
| Canadians | 87.9 /100 | #135 | Excellent 66.8% |
Demographics Similar to Immigrants from Belize by College, Under 1 year
In terms of college, under 1 year, the demographic groups most similar to Immigrants from Belize are Seminole (59.1%, a difference of 0.020%), Immigrants from Grenada (59.1%, a difference of 0.10%), Central American Indian (59.0%, a difference of 0.14%), Guyanese (59.0%, a difference of 0.19%), and Nicaraguan (59.2%, a difference of 0.20%).
| Demographics | Rating | Rank | College, Under 1 year |
| Sioux | 0.0 /100 | #287 | Tragic 59.4% |
| Blacks/African Americans | 0.0 /100 | #288 | Tragic 59.4% |
| Choctaw | 0.0 /100 | #289 | Tragic 59.3% |
| Ecuadorians | 0.0 /100 | #290 | Tragic 59.3% |
| Creek | 0.0 /100 | #291 | Tragic 59.3% |
| Nicaraguans | 0.0 /100 | #292 | Tragic 59.2% |
| Seminole | 0.0 /100 | #293 | Tragic 59.1% |
| Immigrants | Belize | 0.0 /100 | #294 | Tragic 59.1% |
| Immigrants | Grenada | 0.0 /100 | #295 | Tragic 59.1% |
| Central American Indians | 0.0 /100 | #296 | Tragic 59.0% |
| Guyanese | 0.0 /100 | #297 | Tragic 59.0% |
| Immigrants | Ecuador | 0.0 /100 | #298 | Tragic 58.7% |
| Cubans | 0.0 /100 | #299 | Tragic 58.6% |
| Immigrants | Guyana | 0.0 /100 | #300 | Tragic 58.5% |
| Mexican American Indians | 0.0 /100 | #301 | Tragic 58.1% |