Immigrants from North America vs Immigrants from Belize College, Under 1 year
COMPARE
Immigrants from North America
Immigrants from Belize
College, Under 1 year
College, Under 1 year Comparison
Immigrants from North America
Immigrants from Belize
69.0%
COLLEGE, UNDER 1 YEAR
99.3/ 100
METRIC RATING
66th/ 347
METRIC RANK
59.1%
COLLEGE, UNDER 1 YEAR
0.0/ 100
METRIC RATING
294th/ 347
METRIC RANK
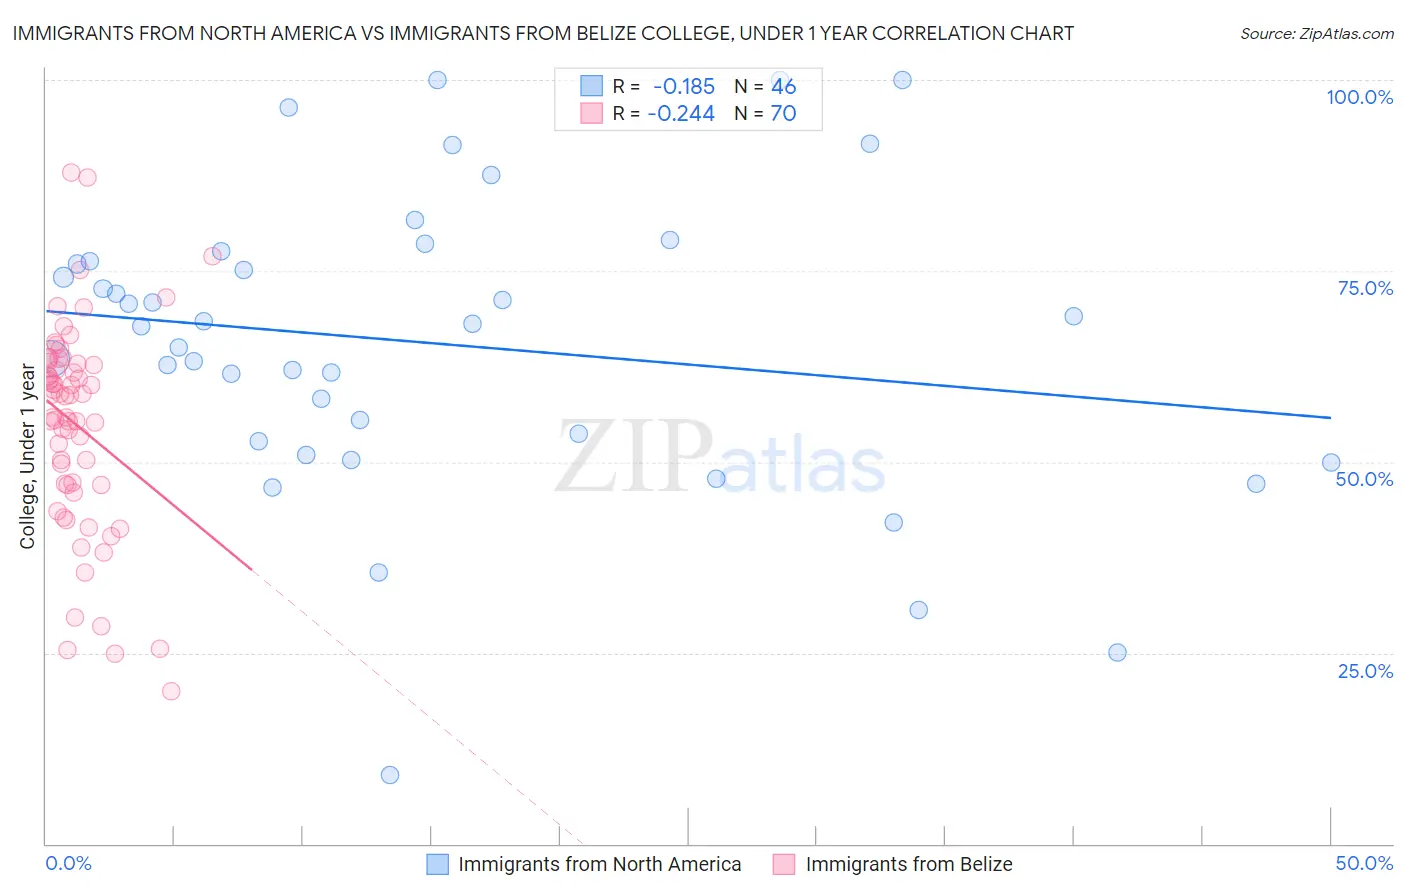
Immigrants from North America vs Immigrants from Belize College, Under 1 year Correlation Chart
The statistical analysis conducted on geographies consisting of 462,457,398 people shows a poor negative correlation between the proportion of Immigrants from North America and percentage of population with at least college, under 1 year education in the United States with a correlation coefficient (R) of -0.185 and weighted average of 69.0%. Similarly, the statistical analysis conducted on geographies consisting of 130,329,081 people shows a weak negative correlation between the proportion of Immigrants from Belize and percentage of population with at least college, under 1 year education in the United States with a correlation coefficient (R) of -0.244 and weighted average of 59.1%, a difference of 16.7%.
College, Under 1 year Correlation Summary
| Measurement | Immigrants from North America | Immigrants from Belize |
| Minimum | 9.0% | 19.9% |
| Maximum | 100.0% | 87.9% |
| Range | 91.0% | 68.0% |
| Mean | 65.5% | 54.9% |
| Median | 67.9% | 58.7% |
| Interquartile 25% (IQ1) | 52.7% | 47.0% |
| Interquartile 75% (IQ3) | 76.3% | 62.9% |
| Interquartile Range (IQR) | 23.6% | 15.9% |
| Standard Deviation (Sample) | 19.7% | 13.7% |
| Standard Deviation (Population) | 19.5% | 13.6% |
Similar Demographics by College, Under 1 year
Demographics Similar to Immigrants from North America by College, Under 1 year
In terms of college, under 1 year, the demographic groups most similar to Immigrants from North America are Immigrants from Moldova (69.0%, a difference of 0.030%), Northern European (69.0%, a difference of 0.040%), Immigrants from Canada (69.1%, a difference of 0.080%), Immigrants from Zimbabwe (68.9%, a difference of 0.14%), and Immigrants from Indonesia (68.9%, a difference of 0.17%).
| Demographics | Rating | Rank | College, Under 1 year |
| Immigrants | Serbia | 99.5 /100 | #59 | Exceptional 69.3% |
| Immigrants | Asia | 99.5 /100 | #60 | Exceptional 69.2% |
| Immigrants | Kazakhstan | 99.5 /100 | #61 | Exceptional 69.2% |
| Immigrants | Belarus | 99.5 /100 | #62 | Exceptional 69.2% |
| Immigrants | Canada | 99.4 /100 | #63 | Exceptional 69.1% |
| Northern Europeans | 99.4 /100 | #64 | Exceptional 69.0% |
| Immigrants | Moldova | 99.3 /100 | #65 | Exceptional 69.0% |
| Immigrants | North America | 99.3 /100 | #66 | Exceptional 69.0% |
| Immigrants | Zimbabwe | 99.2 /100 | #67 | Exceptional 68.9% |
| Immigrants | Indonesia | 99.2 /100 | #68 | Exceptional 68.9% |
| Immigrants | Romania | 99.2 /100 | #69 | Exceptional 68.9% |
| Lithuanians | 99.1 /100 | #70 | Exceptional 68.8% |
| Immigrants | Europe | 99.1 /100 | #71 | Exceptional 68.8% |
| Bolivians | 99.0 /100 | #72 | Exceptional 68.7% |
| Immigrants | England | 99.0 /100 | #73 | Exceptional 68.7% |
Demographics Similar to Immigrants from Belize by College, Under 1 year
In terms of college, under 1 year, the demographic groups most similar to Immigrants from Belize are Seminole (59.1%, a difference of 0.020%), Immigrants from Grenada (59.1%, a difference of 0.10%), Central American Indian (59.0%, a difference of 0.14%), Guyanese (59.0%, a difference of 0.19%), and Nicaraguan (59.2%, a difference of 0.20%).
| Demographics | Rating | Rank | College, Under 1 year |
| Sioux | 0.0 /100 | #287 | Tragic 59.4% |
| Blacks/African Americans | 0.0 /100 | #288 | Tragic 59.4% |
| Choctaw | 0.0 /100 | #289 | Tragic 59.3% |
| Ecuadorians | 0.0 /100 | #290 | Tragic 59.3% |
| Creek | 0.0 /100 | #291 | Tragic 59.3% |
| Nicaraguans | 0.0 /100 | #292 | Tragic 59.2% |
| Seminole | 0.0 /100 | #293 | Tragic 59.1% |
| Immigrants | Belize | 0.0 /100 | #294 | Tragic 59.1% |
| Immigrants | Grenada | 0.0 /100 | #295 | Tragic 59.1% |
| Central American Indians | 0.0 /100 | #296 | Tragic 59.0% |
| Guyanese | 0.0 /100 | #297 | Tragic 59.0% |
| Immigrants | Ecuador | 0.0 /100 | #298 | Tragic 58.7% |
| Cubans | 0.0 /100 | #299 | Tragic 58.6% |
| Immigrants | Guyana | 0.0 /100 | #300 | Tragic 58.5% |
| Mexican American Indians | 0.0 /100 | #301 | Tragic 58.1% |