Dutch West Indian vs Immigrants from Belize College, Under 1 year
COMPARE
Dutch West Indian
Immigrants from Belize
College, Under 1 year
College, Under 1 year Comparison
Dutch West Indians
Immigrants from Belize
57.2%
COLLEGE, UNDER 1 YEAR
0.0/ 100
METRIC RATING
313th/ 347
METRIC RANK
59.1%
COLLEGE, UNDER 1 YEAR
0.0/ 100
METRIC RATING
294th/ 347
METRIC RANK
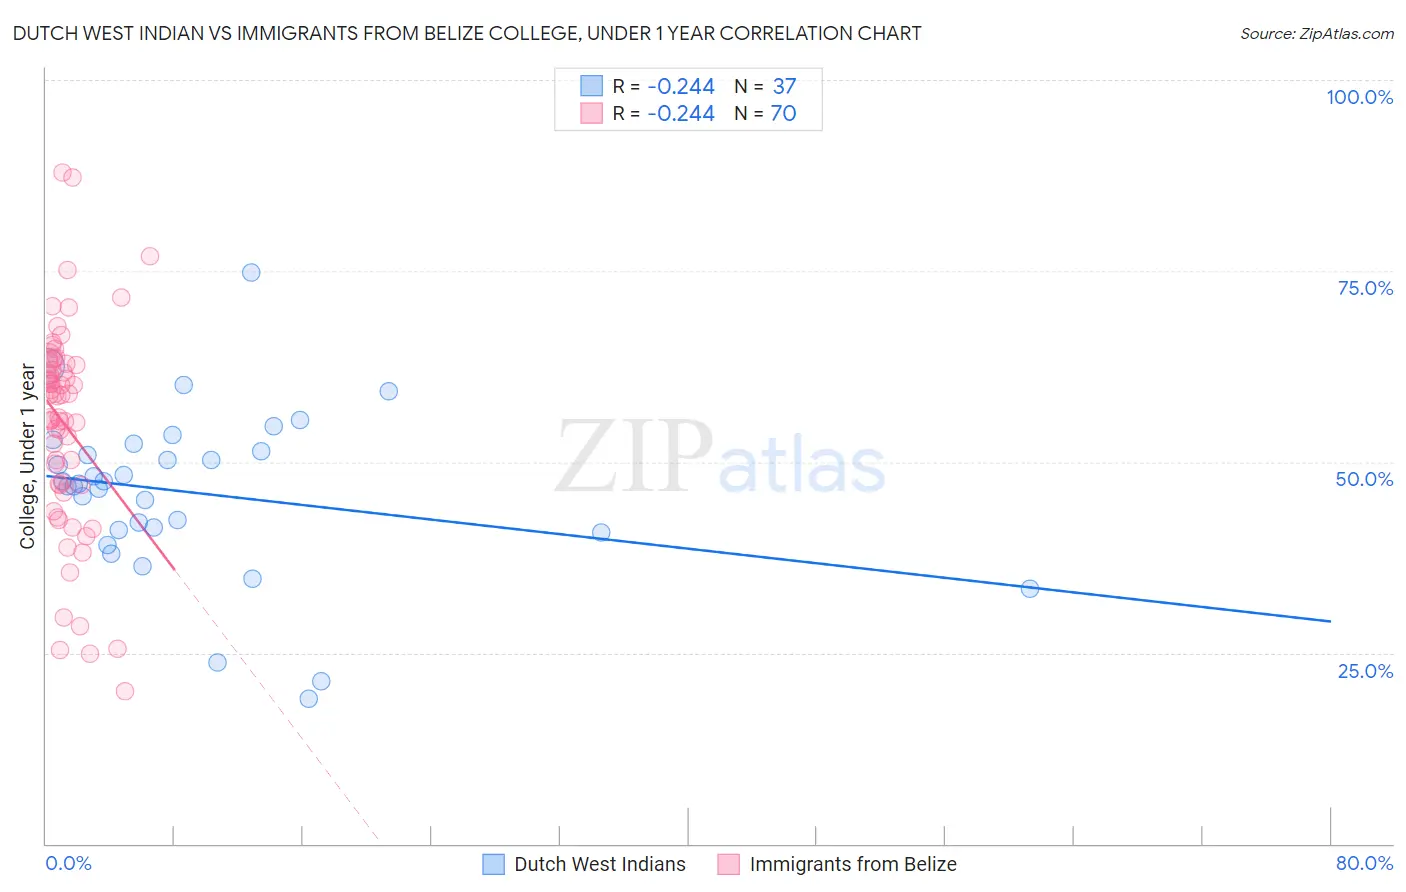
Dutch West Indian vs Immigrants from Belize College, Under 1 year Correlation Chart
The statistical analysis conducted on geographies consisting of 85,776,067 people shows a weak negative correlation between the proportion of Dutch West Indians and percentage of population with at least college, under 1 year education in the United States with a correlation coefficient (R) of -0.244 and weighted average of 57.2%. Similarly, the statistical analysis conducted on geographies consisting of 130,329,081 people shows a weak negative correlation between the proportion of Immigrants from Belize and percentage of population with at least college, under 1 year education in the United States with a correlation coefficient (R) of -0.244 and weighted average of 59.1%, a difference of 3.4%.
College, Under 1 year Correlation Summary
| Measurement | Dutch West Indian | Immigrants from Belize |
| Minimum | 19.0% | 19.9% |
| Maximum | 74.8% | 87.9% |
| Range | 55.8% | 68.0% |
| Mean | 45.9% | 54.9% |
| Median | 47.1% | 58.7% |
| Interquartile 25% (IQ1) | 40.9% | 47.0% |
| Interquartile 75% (IQ3) | 51.9% | 62.9% |
| Interquartile Range (IQR) | 11.1% | 15.9% |
| Standard Deviation (Sample) | 11.0% | 13.7% |
| Standard Deviation (Population) | 10.8% | 13.6% |
Demographics Similar to Dutch West Indians and Immigrants from Belize by College, Under 1 year
In terms of college, under 1 year, the demographic groups most similar to Dutch West Indians are Salvadoran (57.3%, a difference of 0.24%), Cajun (57.3%, a difference of 0.31%), Pueblo (57.4%, a difference of 0.36%), Immigrants from Nicaragua (57.6%, a difference of 0.76%), and Fijian (57.7%, a difference of 0.88%). Similarly, the demographic groups most similar to Immigrants from Belize are Seminole (59.1%, a difference of 0.020%), Immigrants from Grenada (59.1%, a difference of 0.10%), Central American Indian (59.0%, a difference of 0.14%), Guyanese (59.0%, a difference of 0.19%), and Immigrants from Ecuador (58.7%, a difference of 0.69%).
| Demographics | Rating | Rank | College, Under 1 year |
| Seminole | 0.0 /100 | #293 | Tragic 59.1% |
| Immigrants | Belize | 0.0 /100 | #294 | Tragic 59.1% |
| Immigrants | Grenada | 0.0 /100 | #295 | Tragic 59.1% |
| Central American Indians | 0.0 /100 | #296 | Tragic 59.0% |
| Guyanese | 0.0 /100 | #297 | Tragic 59.0% |
| Immigrants | Ecuador | 0.0 /100 | #298 | Tragic 58.7% |
| Cubans | 0.0 /100 | #299 | Tragic 58.6% |
| Immigrants | Guyana | 0.0 /100 | #300 | Tragic 58.5% |
| Mexican American Indians | 0.0 /100 | #301 | Tragic 58.1% |
| Apache | 0.0 /100 | #302 | Tragic 58.0% |
| Immigrants | Dominica | 0.0 /100 | #303 | Tragic 57.9% |
| Kiowa | 0.0 /100 | #304 | Tragic 57.8% |
| Haitians | 0.0 /100 | #305 | Tragic 57.8% |
| Immigrants | Portugal | 0.0 /100 | #306 | Tragic 57.7% |
| Fijians | 0.0 /100 | #307 | Tragic 57.7% |
| Central Americans | 0.0 /100 | #308 | Tragic 57.7% |
| Immigrants | Nicaragua | 0.0 /100 | #309 | Tragic 57.6% |
| Pueblo | 0.0 /100 | #310 | Tragic 57.4% |
| Cajuns | 0.0 /100 | #311 | Tragic 57.3% |
| Salvadorans | 0.0 /100 | #312 | Tragic 57.3% |
| Dutch West Indians | 0.0 /100 | #313 | Tragic 57.2% |