Scottish vs Immigrants from Belize In Labor Force | Age > 16
COMPARE
Scottish
Immigrants from Belize
In Labor Force | Age > 16
In Labor Force | Age > 16 Comparison
Scottish
Immigrants from Belize
63.9%
IN LABOR FORCE | AGE > 16
0.1/ 100
METRIC RATING
287th/ 347
METRIC RANK
64.7%
IN LABOR FORCE | AGE > 16
9.2/ 100
METRIC RATING
223rd/ 347
METRIC RANK
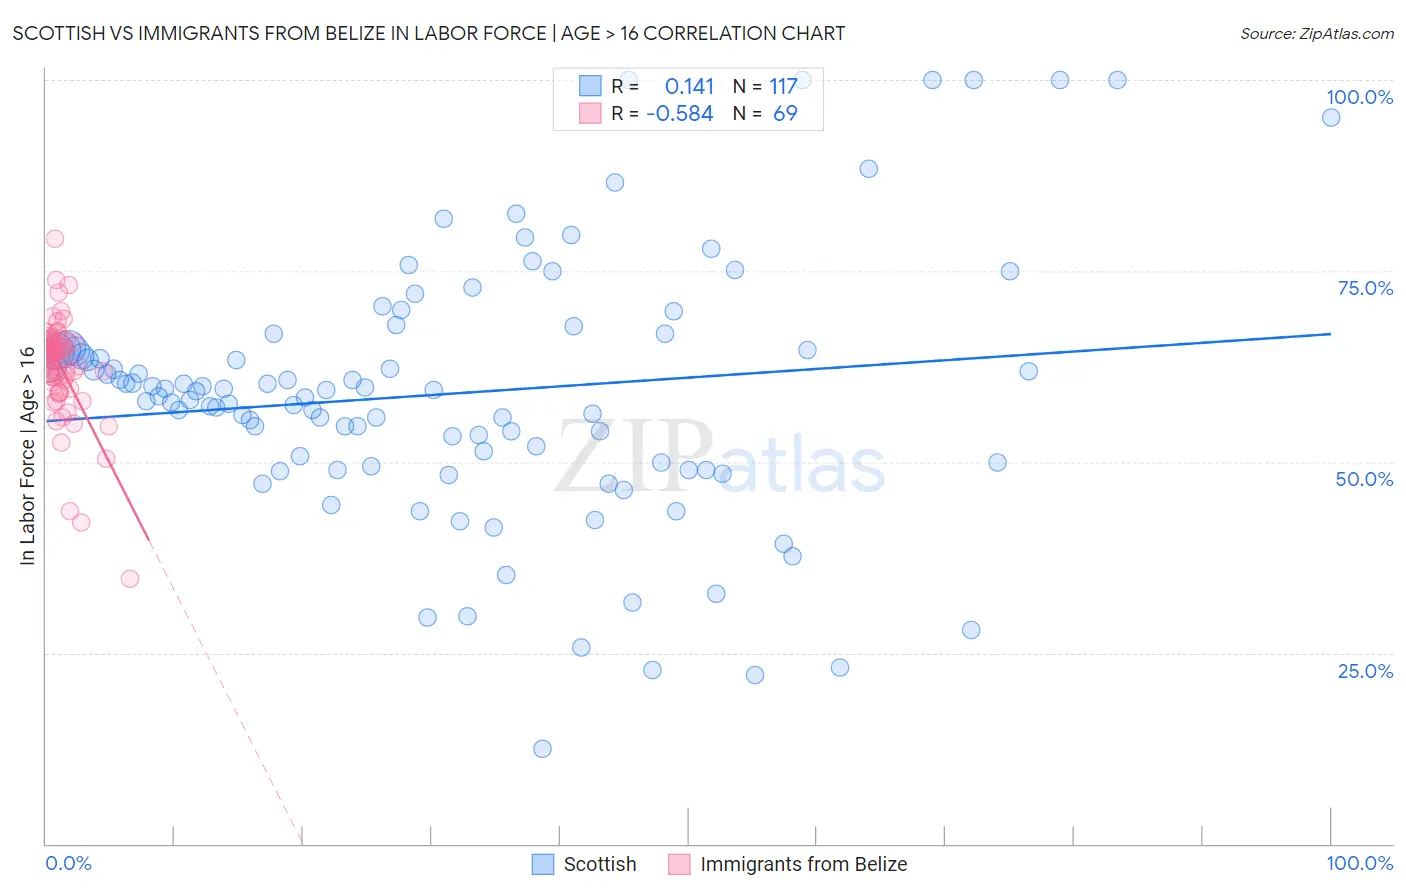
Scottish vs Immigrants from Belize In Labor Force | Age > 16 Correlation Chart
The statistical analysis conducted on geographies consisting of 567,155,929 people shows a poor positive correlation between the proportion of Scottish and labor force participation rate among population ages 16 and over in the United States with a correlation coefficient (R) of 0.141 and weighted average of 63.9%. Similarly, the statistical analysis conducted on geographies consisting of 130,317,251 people shows a substantial negative correlation between the proportion of Immigrants from Belize and labor force participation rate among population ages 16 and over in the United States with a correlation coefficient (R) of -0.584 and weighted average of 64.7%, a difference of 1.3%.
In Labor Force | Age > 16 Correlation Summary
| Measurement | Scottish | Immigrants from Belize |
| Minimum | 12.5% | 34.7% |
| Maximum | 100.0% | 79.2% |
| Range | 87.5% | 44.5% |
| Mean | 58.9% | 62.3% |
| Median | 59.3% | 63.8% |
| Interquartile 25% (IQ1) | 49.7% | 59.9% |
| Interquartile 75% (IQ3) | 64.8% | 65.8% |
| Interquartile Range (IQR) | 15.1% | 5.9% |
| Standard Deviation (Sample) | 17.1% | 6.8% |
| Standard Deviation (Population) | 17.1% | 6.8% |
Similar Demographics by In Labor Force | Age > 16
Demographics Similar to Scottish by In Labor Force | Age > 16
In terms of in labor force | age > 16, the demographic groups most similar to Scottish are Immigrants from Austria (63.9%, a difference of 0.0%), Slovak (63.9%, a difference of 0.030%), Spanish (63.9%, a difference of 0.050%), French (63.9%, a difference of 0.060%), and Immigrants from Germany (63.9%, a difference of 0.070%).
| Demographics | Rating | Rank | In Labor Force | Age > 16 |
| Immigrants | St. Vincent and the Grenadines | 0.2 /100 | #280 | Tragic 64.0% |
| French Canadians | 0.2 /100 | #281 | Tragic 64.0% |
| Immigrants | Guyana | 0.2 /100 | #282 | Tragic 64.0% |
| Immigrants | Germany | 0.1 /100 | #283 | Tragic 63.9% |
| French | 0.1 /100 | #284 | Tragic 63.9% |
| Slovaks | 0.1 /100 | #285 | Tragic 63.9% |
| Immigrants | Austria | 0.1 /100 | #286 | Tragic 63.9% |
| Scottish | 0.1 /100 | #287 | Tragic 63.9% |
| Spanish | 0.1 /100 | #288 | Tragic 63.9% |
| Celtics | 0.1 /100 | #289 | Tragic 63.8% |
| Hungarians | 0.1 /100 | #290 | Tragic 63.8% |
| Nepalese | 0.1 /100 | #291 | Tragic 63.8% |
| Spanish American Indians | 0.1 /100 | #292 | Tragic 63.8% |
| English | 0.1 /100 | #293 | Tragic 63.7% |
| Puget Sound Salish | 0.0 /100 | #294 | Tragic 63.7% |
Demographics Similar to Immigrants from Belize by In Labor Force | Age > 16
In terms of in labor force | age > 16, the demographic groups most similar to Immigrants from Belize are Hawaiian (64.7%, a difference of 0.0%), Immigrants from Micronesia (64.7%, a difference of 0.010%), Immigrants from Jamaica (64.7%, a difference of 0.010%), Croatian (64.7%, a difference of 0.010%), and Alaska Native (64.7%, a difference of 0.020%).
| Demographics | Rating | Rank | In Labor Force | Age > 16 |
| Belgians | 11.4 /100 | #216 | Poor 64.7% |
| U.S. Virgin Islanders | 11.3 /100 | #217 | Poor 64.7% |
| Alsatians | 10.7 /100 | #218 | Poor 64.7% |
| Immigrants | Central America | 10.5 /100 | #219 | Poor 64.7% |
| Alaska Natives | 9.9 /100 | #220 | Tragic 64.7% |
| Immigrants | Micronesia | 9.6 /100 | #221 | Tragic 64.7% |
| Hawaiians | 9.3 /100 | #222 | Tragic 64.7% |
| Immigrants | Belize | 9.2 /100 | #223 | Tragic 64.7% |
| Immigrants | Jamaica | 8.8 /100 | #224 | Tragic 64.7% |
| Croatians | 8.8 /100 | #225 | Tragic 64.7% |
| Europeans | 8.3 /100 | #226 | Tragic 64.7% |
| Poles | 8.3 /100 | #227 | Tragic 64.7% |
| Northern Europeans | 8.2 /100 | #228 | Tragic 64.7% |
| British | 7.3 /100 | #229 | Tragic 64.7% |
| Chinese | 7.3 /100 | #230 | Tragic 64.7% |