Scottish vs Jordanian College, Under 1 year
COMPARE
Scottish
Jordanian
College, Under 1 year
College, Under 1 year Comparison
Scottish
Jordanians
67.0%
COLLEGE, UNDER 1 YEAR
90.2/ 100
METRIC RATING
128th/ 347
METRIC RANK
68.0%
COLLEGE, UNDER 1 YEAR
97.4/ 100
METRIC RATING
96th/ 347
METRIC RANK
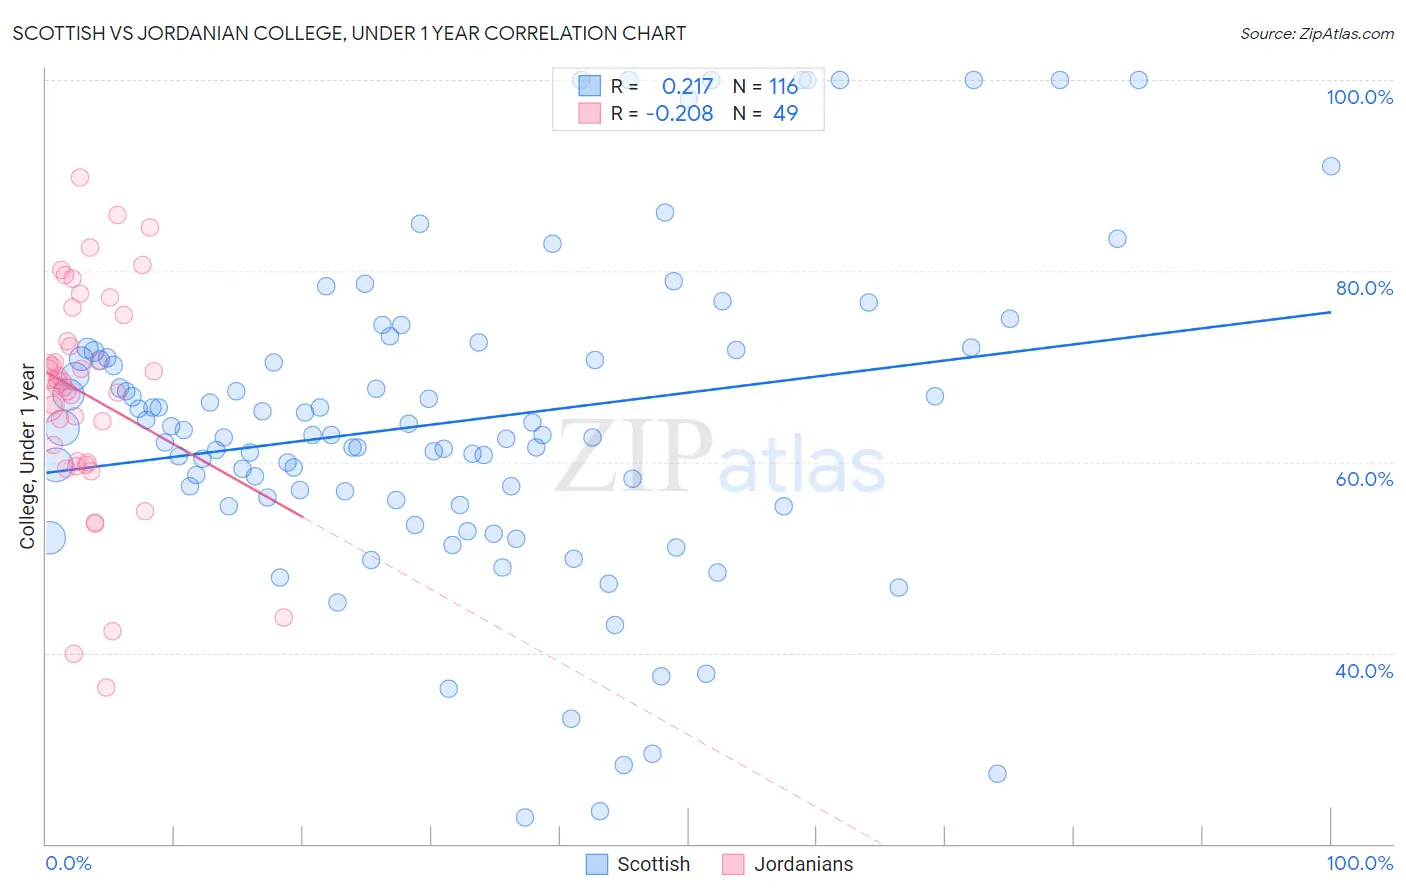
Scottish vs Jordanian College, Under 1 year Correlation Chart
The statistical analysis conducted on geographies consisting of 567,137,181 people shows a weak positive correlation between the proportion of Scottish and percentage of population with at least college, under 1 year education in the United States with a correlation coefficient (R) of 0.217 and weighted average of 67.0%. Similarly, the statistical analysis conducted on geographies consisting of 166,424,117 people shows a weak negative correlation between the proportion of Jordanians and percentage of population with at least college, under 1 year education in the United States with a correlation coefficient (R) of -0.208 and weighted average of 68.0%, a difference of 1.5%.
College, Under 1 year Correlation Summary
| Measurement | Scottish | Jordanian |
| Minimum | 22.8% | 36.4% |
| Maximum | 100.0% | 89.8% |
| Range | 77.2% | 53.4% |
| Mean | 64.2% | 67.0% |
| Median | 62.8% | 68.5% |
| Interquartile 25% (IQ1) | 56.1% | 60.0% |
| Interquartile 75% (IQ3) | 71.2% | 74.0% |
| Interquartile Range (IQR) | 15.1% | 14.0% |
| Standard Deviation (Sample) | 16.6% | 11.5% |
| Standard Deviation (Population) | 16.6% | 11.3% |
Similar Demographics by College, Under 1 year
Demographics Similar to Scottish by College, Under 1 year
In terms of college, under 1 year, the demographic groups most similar to Scottish are Czech (67.1%, a difference of 0.070%), Immigrants from Eastern Africa (67.0%, a difference of 0.080%), Alsatian (67.1%, a difference of 0.14%), Immigrants from Syria (66.9%, a difference of 0.14%), and Finnish (66.9%, a difference of 0.19%).
| Demographics | Rating | Rank | College, Under 1 year |
| Slovenes | 93.3 /100 | #121 | Exceptional 67.3% |
| Immigrants | Jordan | 92.8 /100 | #122 | Exceptional 67.3% |
| Immigrants | Northern Africa | 92.7 /100 | #123 | Exceptional 67.2% |
| Arabs | 92.6 /100 | #124 | Exceptional 67.2% |
| Italians | 91.8 /100 | #125 | Exceptional 67.2% |
| Alsatians | 91.3 /100 | #126 | Exceptional 67.1% |
| Czechs | 90.8 /100 | #127 | Exceptional 67.1% |
| Scottish | 90.2 /100 | #128 | Exceptional 67.0% |
| Immigrants | Eastern Africa | 89.5 /100 | #129 | Excellent 67.0% |
| Immigrants | Syria | 89.0 /100 | #130 | Excellent 66.9% |
| Finns | 88.6 /100 | #131 | Excellent 66.9% |
| Poles | 88.4 /100 | #132 | Excellent 66.9% |
| Immigrants | Brazil | 88.3 /100 | #133 | Excellent 66.9% |
| Iraqis | 88.0 /100 | #134 | Excellent 66.8% |
| Canadians | 87.9 /100 | #135 | Excellent 66.8% |
Demographics Similar to Jordanians by College, Under 1 year
In terms of college, under 1 year, the demographic groups most similar to Jordanians are Immigrants from Pakistan (68.0%, a difference of 0.030%), Immigrants from Ethiopia (68.0%, a difference of 0.030%), Armenian (68.1%, a difference of 0.13%), Paraguayan (67.9%, a difference of 0.13%), and Immigrants from Bolivia (67.9%, a difference of 0.15%).
| Demographics | Rating | Rank | College, Under 1 year |
| Ethiopians | 98.2 /100 | #89 | Exceptional 68.3% |
| Icelanders | 98.1 /100 | #90 | Exceptional 68.3% |
| Europeans | 98.1 /100 | #91 | Exceptional 68.2% |
| Luxembourgers | 98.1 /100 | #92 | Exceptional 68.2% |
| Romanians | 97.9 /100 | #93 | Exceptional 68.2% |
| Armenians | 97.7 /100 | #94 | Exceptional 68.1% |
| Immigrants | Pakistan | 97.5 /100 | #95 | Exceptional 68.0% |
| Jordanians | 97.4 /100 | #96 | Exceptional 68.0% |
| Immigrants | Ethiopia | 97.3 /100 | #97 | Exceptional 68.0% |
| Paraguayans | 97.1 /100 | #98 | Exceptional 67.9% |
| Immigrants | Bolivia | 97.0 /100 | #99 | Exceptional 67.9% |
| Immigrants | Argentina | 97.0 /100 | #100 | Exceptional 67.9% |
| Immigrants | Eastern Europe | 96.9 /100 | #101 | Exceptional 67.9% |
| Palestinians | 96.9 /100 | #102 | Exceptional 67.9% |
| Carpatho Rusyns | 96.8 /100 | #103 | Exceptional 67.9% |