Scottish vs Bulgarian College, Under 1 year
COMPARE
Scottish
Bulgarian
College, Under 1 year
College, Under 1 year Comparison
Scottish
Bulgarians
67.0%
COLLEGE, UNDER 1 YEAR
90.2/ 100
METRIC RATING
128th/ 347
METRIC RANK
71.1%
COLLEGE, UNDER 1 YEAR
100.0/ 100
METRIC RATING
25th/ 347
METRIC RANK
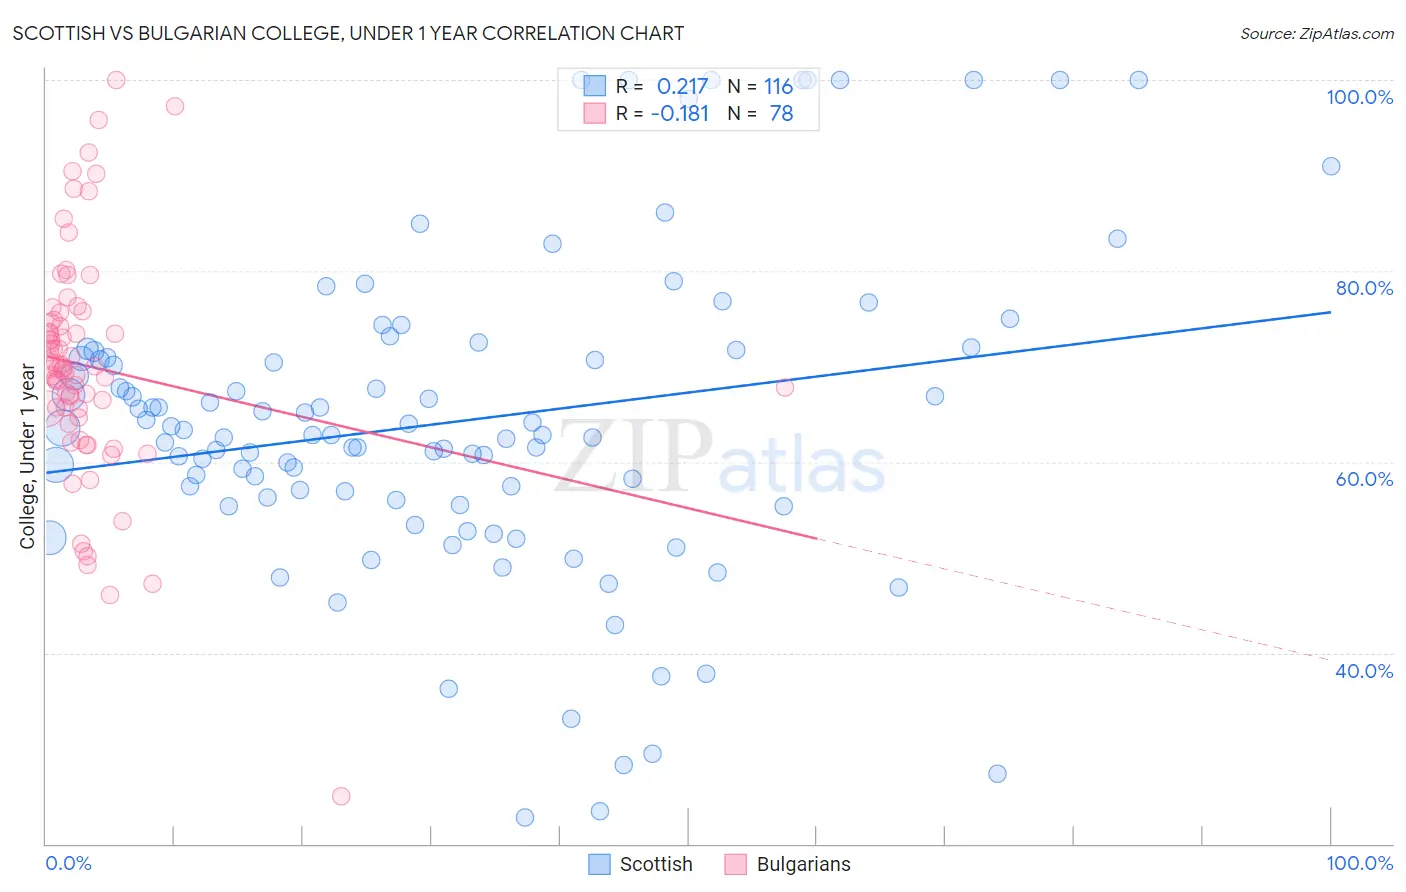
Scottish vs Bulgarian College, Under 1 year Correlation Chart
The statistical analysis conducted on geographies consisting of 567,137,181 people shows a weak positive correlation between the proportion of Scottish and percentage of population with at least college, under 1 year education in the United States with a correlation coefficient (R) of 0.217 and weighted average of 67.0%. Similarly, the statistical analysis conducted on geographies consisting of 205,631,725 people shows a poor negative correlation between the proportion of Bulgarians and percentage of population with at least college, under 1 year education in the United States with a correlation coefficient (R) of -0.181 and weighted average of 71.1%, a difference of 6.1%.
College, Under 1 year Correlation Summary
| Measurement | Scottish | Bulgarian |
| Minimum | 22.8% | 25.0% |
| Maximum | 100.0% | 100.0% |
| Range | 77.2% | 75.0% |
| Mean | 64.2% | 70.0% |
| Median | 62.8% | 69.8% |
| Interquartile 25% (IQ1) | 56.1% | 65.6% |
| Interquartile 75% (IQ3) | 71.2% | 74.8% |
| Interquartile Range (IQR) | 15.1% | 9.3% |
| Standard Deviation (Sample) | 16.6% | 12.2% |
| Standard Deviation (Population) | 16.6% | 12.1% |
Similar Demographics by College, Under 1 year
Demographics Similar to Scottish by College, Under 1 year
In terms of college, under 1 year, the demographic groups most similar to Scottish are Czech (67.1%, a difference of 0.070%), Immigrants from Eastern Africa (67.0%, a difference of 0.080%), Alsatian (67.1%, a difference of 0.14%), Immigrants from Syria (66.9%, a difference of 0.14%), and Finnish (66.9%, a difference of 0.19%).
| Demographics | Rating | Rank | College, Under 1 year |
| Slovenes | 93.3 /100 | #121 | Exceptional 67.3% |
| Immigrants | Jordan | 92.8 /100 | #122 | Exceptional 67.3% |
| Immigrants | Northern Africa | 92.7 /100 | #123 | Exceptional 67.2% |
| Arabs | 92.6 /100 | #124 | Exceptional 67.2% |
| Italians | 91.8 /100 | #125 | Exceptional 67.2% |
| Alsatians | 91.3 /100 | #126 | Exceptional 67.1% |
| Czechs | 90.8 /100 | #127 | Exceptional 67.1% |
| Scottish | 90.2 /100 | #128 | Exceptional 67.0% |
| Immigrants | Eastern Africa | 89.5 /100 | #129 | Excellent 67.0% |
| Immigrants | Syria | 89.0 /100 | #130 | Excellent 66.9% |
| Finns | 88.6 /100 | #131 | Excellent 66.9% |
| Poles | 88.4 /100 | #132 | Excellent 66.9% |
| Immigrants | Brazil | 88.3 /100 | #133 | Excellent 66.9% |
| Iraqis | 88.0 /100 | #134 | Excellent 66.8% |
| Canadians | 87.9 /100 | #135 | Excellent 66.8% |
Demographics Similar to Bulgarians by College, Under 1 year
In terms of college, under 1 year, the demographic groups most similar to Bulgarians are Soviet Union (71.1%, a difference of 0.020%), Immigrants from Northern Europe (71.1%, a difference of 0.030%), Immigrants from Denmark (71.0%, a difference of 0.12%), Immigrants from Ireland (71.0%, a difference of 0.13%), and Immigrants from Hong Kong (71.0%, a difference of 0.15%).
| Demographics | Rating | Rank | College, Under 1 year |
| Immigrants | Switzerland | 100.0 /100 | #18 | Exceptional 71.7% |
| Latvians | 100.0 /100 | #19 | Exceptional 71.6% |
| Immigrants | Korea | 100.0 /100 | #20 | Exceptional 71.6% |
| Immigrants | Belgium | 100.0 /100 | #21 | Exceptional 71.5% |
| Immigrants | Eastern Asia | 100.0 /100 | #22 | Exceptional 71.3% |
| Immigrants | Northern Europe | 100.0 /100 | #23 | Exceptional 71.1% |
| Soviet Union | 100.0 /100 | #24 | Exceptional 71.1% |
| Bulgarians | 100.0 /100 | #25 | Exceptional 71.1% |
| Immigrants | Denmark | 100.0 /100 | #26 | Exceptional 71.0% |
| Immigrants | Ireland | 100.0 /100 | #27 | Exceptional 71.0% |
| Immigrants | Hong Kong | 100.0 /100 | #28 | Exceptional 71.0% |
| Immigrants | France | 100.0 /100 | #29 | Exceptional 71.0% |
| Immigrants | China | 99.9 /100 | #30 | Exceptional 70.9% |
| Indians (Asian) | 99.9 /100 | #31 | Exceptional 70.8% |
| Turks | 99.9 /100 | #32 | Exceptional 70.7% |