Scottish vs Immigrants from Western Asia College, Under 1 year
COMPARE
Scottish
Immigrants from Western Asia
College, Under 1 year
College, Under 1 year Comparison
Scottish
Immigrants from Western Asia
67.0%
COLLEGE, UNDER 1 YEAR
90.2/ 100
METRIC RATING
128th/ 347
METRIC RANK
67.8%
COLLEGE, UNDER 1 YEAR
96.6/ 100
METRIC RATING
104th/ 347
METRIC RANK
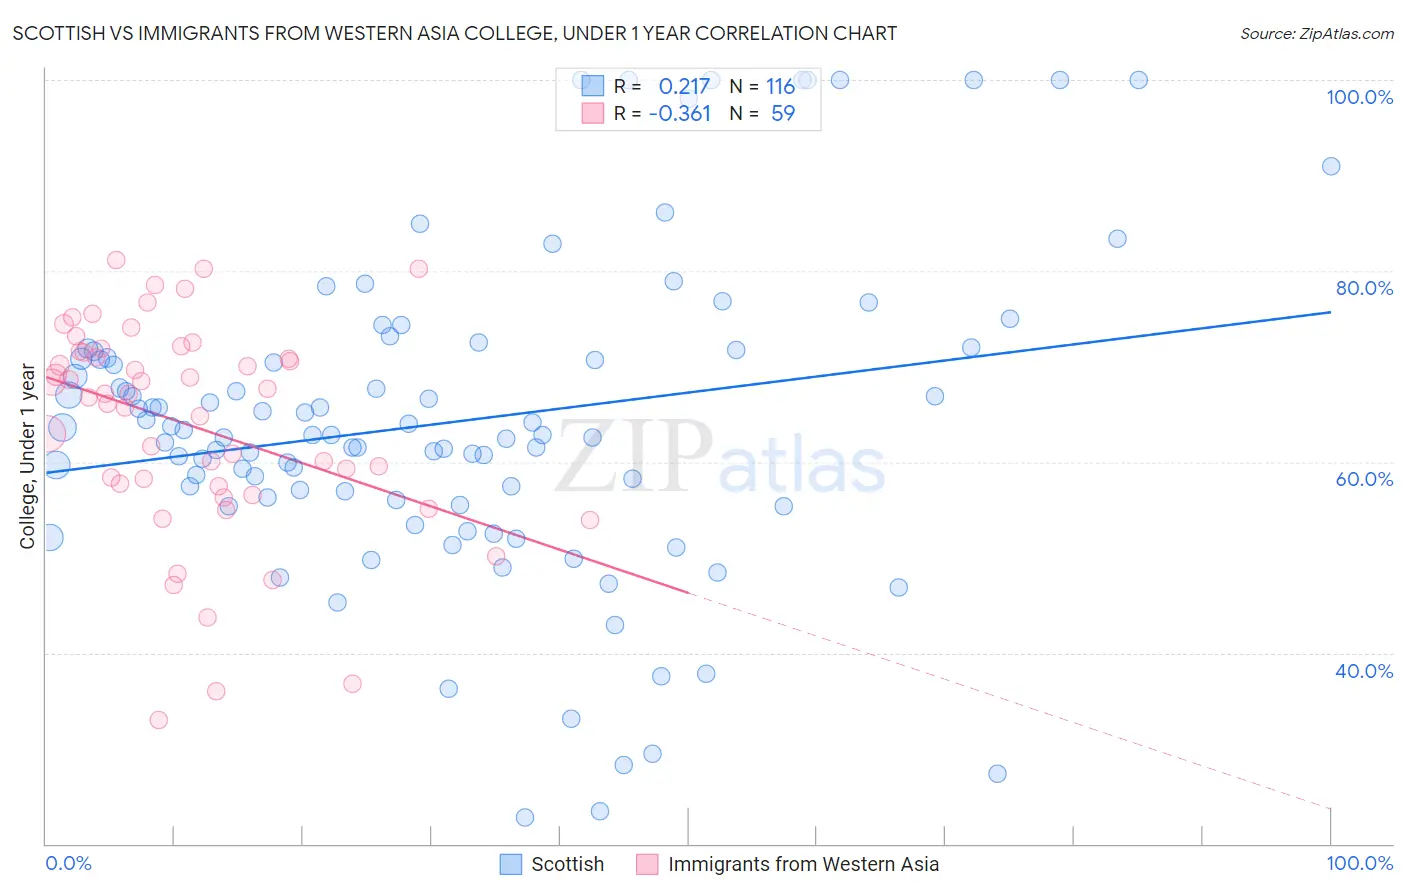
Scottish vs Immigrants from Western Asia College, Under 1 year Correlation Chart
The statistical analysis conducted on geographies consisting of 567,137,181 people shows a weak positive correlation between the proportion of Scottish and percentage of population with at least college, under 1 year education in the United States with a correlation coefficient (R) of 0.217 and weighted average of 67.0%. Similarly, the statistical analysis conducted on geographies consisting of 404,433,725 people shows a mild negative correlation between the proportion of Immigrants from Western Asia and percentage of population with at least college, under 1 year education in the United States with a correlation coefficient (R) of -0.361 and weighted average of 67.8%, a difference of 1.2%.
College, Under 1 year Correlation Summary
| Measurement | Scottish | Immigrants from Western Asia |
| Minimum | 22.8% | 33.0% |
| Maximum | 100.0% | 81.2% |
| Range | 77.2% | 48.2% |
| Mean | 64.2% | 63.9% |
| Median | 62.8% | 67.1% |
| Interquartile 25% (IQ1) | 56.1% | 57.5% |
| Interquartile 75% (IQ3) | 71.2% | 71.6% |
| Interquartile Range (IQR) | 15.1% | 14.2% |
| Standard Deviation (Sample) | 16.6% | 11.2% |
| Standard Deviation (Population) | 16.6% | 11.1% |
Similar Demographics by College, Under 1 year
Demographics Similar to Scottish by College, Under 1 year
In terms of college, under 1 year, the demographic groups most similar to Scottish are Czech (67.1%, a difference of 0.070%), Immigrants from Eastern Africa (67.0%, a difference of 0.080%), Alsatian (67.1%, a difference of 0.14%), Immigrants from Syria (66.9%, a difference of 0.14%), and Finnish (66.9%, a difference of 0.19%).
| Demographics | Rating | Rank | College, Under 1 year |
| Slovenes | 93.3 /100 | #121 | Exceptional 67.3% |
| Immigrants | Jordan | 92.8 /100 | #122 | Exceptional 67.3% |
| Immigrants | Northern Africa | 92.7 /100 | #123 | Exceptional 67.2% |
| Arabs | 92.6 /100 | #124 | Exceptional 67.2% |
| Italians | 91.8 /100 | #125 | Exceptional 67.2% |
| Alsatians | 91.3 /100 | #126 | Exceptional 67.1% |
| Czechs | 90.8 /100 | #127 | Exceptional 67.1% |
| Scottish | 90.2 /100 | #128 | Exceptional 67.0% |
| Immigrants | Eastern Africa | 89.5 /100 | #129 | Excellent 67.0% |
| Immigrants | Syria | 89.0 /100 | #130 | Excellent 66.9% |
| Finns | 88.6 /100 | #131 | Excellent 66.9% |
| Poles | 88.4 /100 | #132 | Excellent 66.9% |
| Immigrants | Brazil | 88.3 /100 | #133 | Excellent 66.9% |
| Iraqis | 88.0 /100 | #134 | Excellent 66.8% |
| Canadians | 87.9 /100 | #135 | Excellent 66.8% |
Demographics Similar to Immigrants from Western Asia by College, Under 1 year
In terms of college, under 1 year, the demographic groups most similar to Immigrants from Western Asia are Afghan (67.8%, a difference of 0.0%), Immigrants from Croatia (67.8%, a difference of 0.010%), Carpatho Rusyn (67.9%, a difference of 0.070%), Austrian (67.8%, a difference of 0.070%), and Immigrants from Eastern Europe (67.9%, a difference of 0.080%).
| Demographics | Rating | Rank | College, Under 1 year |
| Immigrants | Ethiopia | 97.3 /100 | #97 | Exceptional 68.0% |
| Paraguayans | 97.1 /100 | #98 | Exceptional 67.9% |
| Immigrants | Bolivia | 97.0 /100 | #99 | Exceptional 67.9% |
| Immigrants | Argentina | 97.0 /100 | #100 | Exceptional 67.9% |
| Immigrants | Eastern Europe | 96.9 /100 | #101 | Exceptional 67.9% |
| Palestinians | 96.9 /100 | #102 | Exceptional 67.9% |
| Carpatho Rusyns | 96.8 /100 | #103 | Exceptional 67.9% |
| Immigrants | Western Asia | 96.6 /100 | #104 | Exceptional 67.8% |
| Afghans | 96.6 /100 | #105 | Exceptional 67.8% |
| Immigrants | Croatia | 96.6 /100 | #106 | Exceptional 67.8% |
| Austrians | 96.4 /100 | #107 | Exceptional 67.8% |
| Immigrants | Egypt | 96.0 /100 | #108 | Exceptional 67.7% |
| Scandinavians | 95.8 /100 | #109 | Exceptional 67.7% |
| Assyrians/Chaldeans/Syriacs | 95.8 /100 | #110 | Exceptional 67.7% |
| Ukrainians | 95.8 /100 | #111 | Exceptional 67.7% |