Immigrants from Spain vs Immigrants from Belize College, Under 1 year
COMPARE
Immigrants from Spain
Immigrants from Belize
College, Under 1 year
College, Under 1 year Comparison
Immigrants from Spain
Immigrants from Belize
68.4%
COLLEGE, UNDER 1 YEAR
98.5/ 100
METRIC RATING
80th/ 347
METRIC RANK
59.1%
COLLEGE, UNDER 1 YEAR
0.0/ 100
METRIC RATING
294th/ 347
METRIC RANK
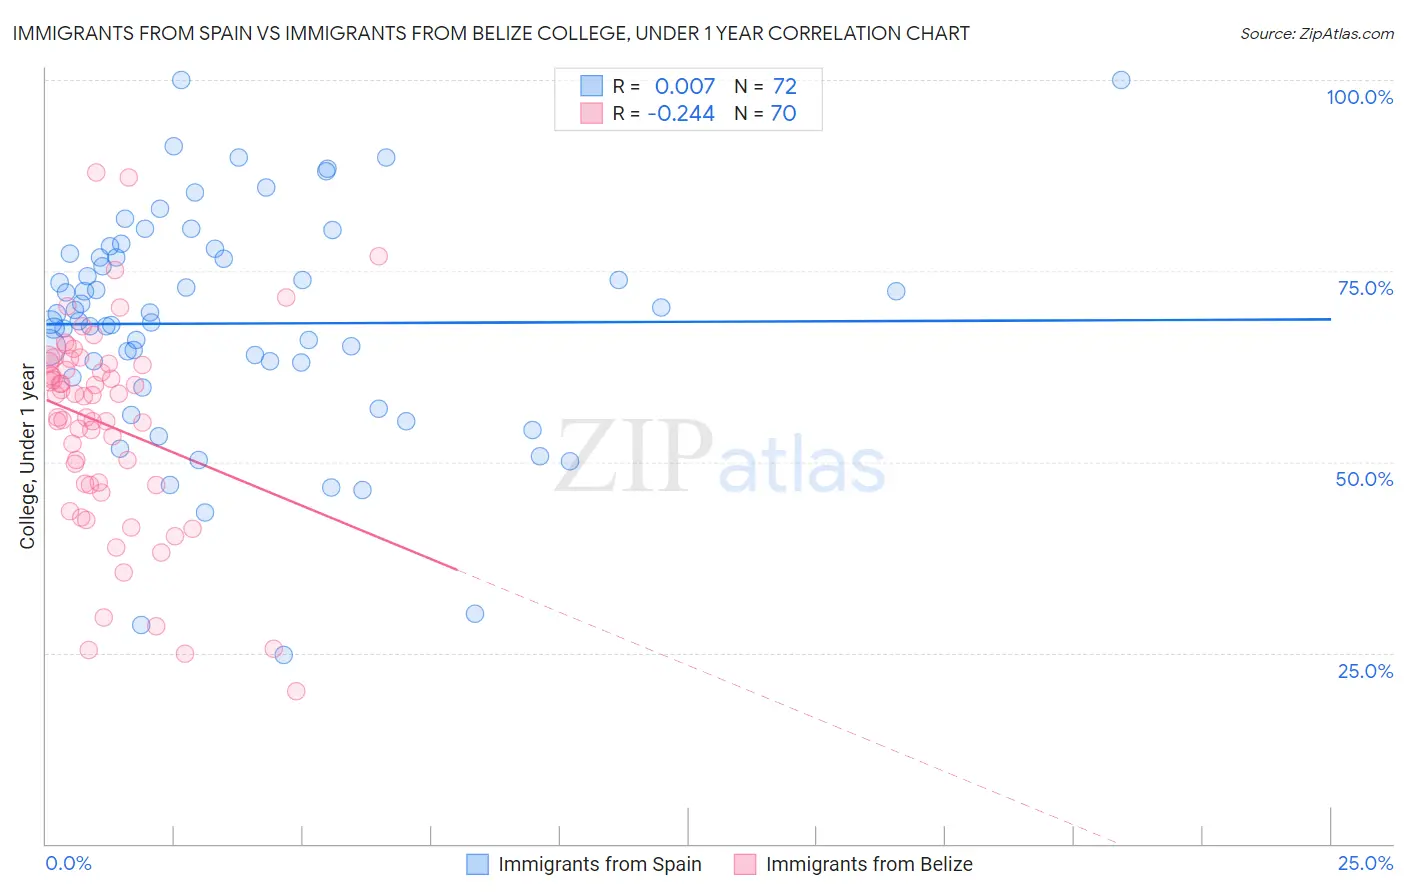
Immigrants from Spain vs Immigrants from Belize College, Under 1 year Correlation Chart
The statistical analysis conducted on geographies consisting of 239,683,397 people shows no correlation between the proportion of Immigrants from Spain and percentage of population with at least college, under 1 year education in the United States with a correlation coefficient (R) of 0.007 and weighted average of 68.4%. Similarly, the statistical analysis conducted on geographies consisting of 130,329,081 people shows a weak negative correlation between the proportion of Immigrants from Belize and percentage of population with at least college, under 1 year education in the United States with a correlation coefficient (R) of -0.244 and weighted average of 59.1%, a difference of 15.8%.
College, Under 1 year Correlation Summary
| Measurement | Immigrants from Spain | Immigrants from Belize |
| Minimum | 24.8% | 19.9% |
| Maximum | 100.0% | 87.9% |
| Range | 75.2% | 68.0% |
| Mean | 68.1% | 54.9% |
| Median | 68.9% | 58.7% |
| Interquartile 25% (IQ1) | 62.0% | 47.0% |
| Interquartile 75% (IQ3) | 77.0% | 62.9% |
| Interquartile Range (IQR) | 15.0% | 15.9% |
| Standard Deviation (Sample) | 15.0% | 13.7% |
| Standard Deviation (Population) | 14.9% | 13.6% |
Similar Demographics by College, Under 1 year
Demographics Similar to Immigrants from Spain by College, Under 1 year
In terms of college, under 1 year, the demographic groups most similar to Immigrants from Spain are Greek (68.5%, a difference of 0.030%), Danish (68.5%, a difference of 0.040%), Immigrants from Greece (68.4%, a difference of 0.040%), British (68.5%, a difference of 0.050%), and Immigrants from Western Europe (68.5%, a difference of 0.090%).
| Demographics | Rating | Rank | College, Under 1 year |
| Immigrants | England | 99.0 /100 | #73 | Exceptional 68.7% |
| Swedes | 98.9 /100 | #74 | Exceptional 68.7% |
| Immigrants | Western Europe | 98.6 /100 | #75 | Exceptional 68.5% |
| Laotians | 98.6 /100 | #76 | Exceptional 68.5% |
| British | 98.6 /100 | #77 | Exceptional 68.5% |
| Danes | 98.6 /100 | #78 | Exceptional 68.5% |
| Greeks | 98.6 /100 | #79 | Exceptional 68.5% |
| Immigrants | Spain | 98.5 /100 | #80 | Exceptional 68.4% |
| Immigrants | Greece | 98.5 /100 | #81 | Exceptional 68.4% |
| Norwegians | 98.4 /100 | #82 | Exceptional 68.4% |
| Argentineans | 98.4 /100 | #83 | Exceptional 68.4% |
| Immigrants | Hungary | 98.3 /100 | #84 | Exceptional 68.3% |
| Egyptians | 98.3 /100 | #85 | Exceptional 68.3% |
| Immigrants | Lebanon | 98.3 /100 | #86 | Exceptional 68.3% |
| Chinese | 98.3 /100 | #87 | Exceptional 68.3% |
Demographics Similar to Immigrants from Belize by College, Under 1 year
In terms of college, under 1 year, the demographic groups most similar to Immigrants from Belize are Seminole (59.1%, a difference of 0.020%), Immigrants from Grenada (59.1%, a difference of 0.10%), Central American Indian (59.0%, a difference of 0.14%), Guyanese (59.0%, a difference of 0.19%), and Nicaraguan (59.2%, a difference of 0.20%).
| Demographics | Rating | Rank | College, Under 1 year |
| Sioux | 0.0 /100 | #287 | Tragic 59.4% |
| Blacks/African Americans | 0.0 /100 | #288 | Tragic 59.4% |
| Choctaw | 0.0 /100 | #289 | Tragic 59.3% |
| Ecuadorians | 0.0 /100 | #290 | Tragic 59.3% |
| Creek | 0.0 /100 | #291 | Tragic 59.3% |
| Nicaraguans | 0.0 /100 | #292 | Tragic 59.2% |
| Seminole | 0.0 /100 | #293 | Tragic 59.1% |
| Immigrants | Belize | 0.0 /100 | #294 | Tragic 59.1% |
| Immigrants | Grenada | 0.0 /100 | #295 | Tragic 59.1% |
| Central American Indians | 0.0 /100 | #296 | Tragic 59.0% |
| Guyanese | 0.0 /100 | #297 | Tragic 59.0% |
| Immigrants | Ecuador | 0.0 /100 | #298 | Tragic 58.7% |
| Cubans | 0.0 /100 | #299 | Tragic 58.6% |
| Immigrants | Guyana | 0.0 /100 | #300 | Tragic 58.5% |
| Mexican American Indians | 0.0 /100 | #301 | Tragic 58.1% |