Scotch-Irish vs Immigrants from Micronesia Householder Income Under 25 years
COMPARE
Scotch-Irish
Immigrants from Micronesia
Householder Income Under 25 years
Householder Income Under 25 years Comparison
Scotch-Irish
Immigrants from Micronesia
$49,039
HOUSEHOLDER INCOME UNDER 25 YEARS
0.0/ 100
METRIC RATING
285th/ 347
METRIC RANK
$50,691
HOUSEHOLDER INCOME UNDER 25 YEARS
2.5/ 100
METRIC RATING
241st/ 347
METRIC RANK
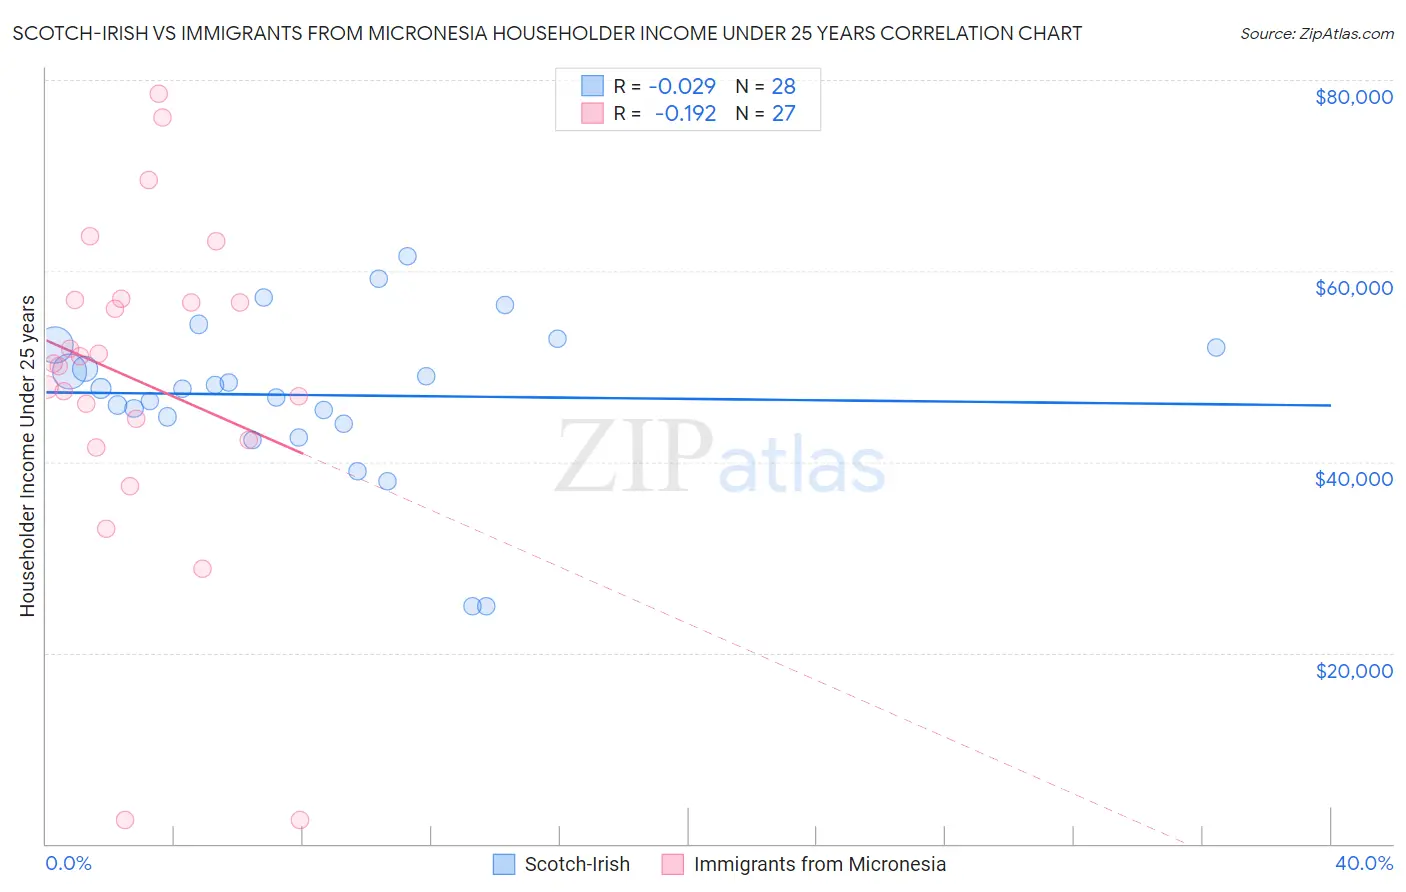
Scotch-Irish vs Immigrants from Micronesia Householder Income Under 25 years Correlation Chart
The statistical analysis conducted on geographies consisting of 427,674,236 people shows no correlation between the proportion of Scotch-Irish and household income with householder under the age of 25 in the United States with a correlation coefficient (R) of -0.029 and weighted average of $49,039. Similarly, the statistical analysis conducted on geographies consisting of 59,129,398 people shows a poor negative correlation between the proportion of Immigrants from Micronesia and household income with householder under the age of 25 in the United States with a correlation coefficient (R) of -0.192 and weighted average of $50,691, a difference of 3.4%.
Householder Income Under 25 years Correlation Summary
| Measurement | Scotch-Irish | Immigrants from Micronesia |
| Minimum | $24,821 | $2,499 |
| Maximum | $61,601 | $78,500 |
| Range | $36,780 | $76,001 |
| Mean | $47,004 | $48,503 |
| Median | $47,645 | $50,317 |
| Interquartile 25% (IQ1) | $44,331 | $42,250 |
| Interquartile 75% (IQ3) | $52,103 | $57,007 |
| Interquartile Range (IQR) | $7,772 | $14,757 |
| Standard Deviation (Sample) | $8,411 | $17,553 |
| Standard Deviation (Population) | $8,259 | $17,225 |
Similar Demographics by Householder Income Under 25 years
Demographics Similar to Scotch-Irish by Householder Income Under 25 years
In terms of householder income under 25 years, the demographic groups most similar to Scotch-Irish are French American Indian ($48,977, a difference of 0.13%), Carpatho Rusyn ($49,113, a difference of 0.15%), Senegalese ($48,953, a difference of 0.18%), Liberian ($48,917, a difference of 0.25%), and Immigrants from Nigeria ($49,174, a difference of 0.28%).
| Demographics | Rating | Rank | Householder Income Under 25 years |
| Nigerians | 0.1 /100 | #278 | Tragic $49,416 |
| Apache | 0.1 /100 | #279 | Tragic $49,395 |
| Hmong | 0.1 /100 | #280 | Tragic $49,364 |
| Immigrants | Nonimmigrants | 0.1 /100 | #281 | Tragic $49,348 |
| Alsatians | 0.1 /100 | #282 | Tragic $49,267 |
| Immigrants | Nigeria | 0.1 /100 | #283 | Tragic $49,174 |
| Carpatho Rusyns | 0.1 /100 | #284 | Tragic $49,113 |
| Scotch-Irish | 0.0 /100 | #285 | Tragic $49,039 |
| French American Indians | 0.0 /100 | #286 | Tragic $48,977 |
| Senegalese | 0.0 /100 | #287 | Tragic $48,953 |
| Liberians | 0.0 /100 | #288 | Tragic $48,917 |
| Hondurans | 0.0 /100 | #289 | Tragic $48,885 |
| Americans | 0.0 /100 | #290 | Tragic $48,860 |
| Immigrants | Burma/Myanmar | 0.0 /100 | #291 | Tragic $48,749 |
| Shoshone | 0.0 /100 | #292 | Tragic $48,720 |
Demographics Similar to Immigrants from Micronesia by Householder Income Under 25 years
In terms of householder income under 25 years, the demographic groups most similar to Immigrants from Micronesia are Cuban ($50,655, a difference of 0.070%), Immigrants from Lebanon ($50,729, a difference of 0.080%), Immigrants from Thailand ($50,645, a difference of 0.090%), Marshallese ($50,627, a difference of 0.12%), and Immigrants from Caribbean ($50,757, a difference of 0.13%).
| Demographics | Rating | Rank | Householder Income Under 25 years |
| Kenyans | 3.3 /100 | #234 | Tragic $50,815 |
| Spanish | 3.3 /100 | #235 | Tragic $50,813 |
| English | 3.3 /100 | #236 | Tragic $50,805 |
| Germans | 3.3 /100 | #237 | Tragic $50,804 |
| Iraqis | 3.2 /100 | #238 | Tragic $50,802 |
| Immigrants | Caribbean | 2.9 /100 | #239 | Tragic $50,757 |
| Immigrants | Lebanon | 2.7 /100 | #240 | Tragic $50,729 |
| Immigrants | Micronesia | 2.5 /100 | #241 | Tragic $50,691 |
| Cubans | 2.3 /100 | #242 | Tragic $50,655 |
| Immigrants | Thailand | 2.2 /100 | #243 | Tragic $50,645 |
| Marshallese | 2.1 /100 | #244 | Tragic $50,627 |
| Immigrants | Africa | 2.0 /100 | #245 | Tragic $50,609 |
| Welsh | 2.0 /100 | #246 | Tragic $50,597 |
| Immigrants | Bosnia and Herzegovina | 1.8 /100 | #247 | Tragic $50,565 |
| Slavs | 1.8 /100 | #248 | Tragic $50,563 |