Scotch-Irish vs Immigrants from Uganda Bachelor's Degree
COMPARE
Scotch-Irish
Immigrants from Uganda
Bachelor's Degree
Bachelor's Degree Comparison
Scotch-Irish
Immigrants from Uganda
36.4%
BACHELOR'S DEGREE
18.3/ 100
METRIC RATING
211th/ 347
METRIC RANK
40.7%
BACHELOR'S DEGREE
95.7/ 100
METRIC RATING
116th/ 347
METRIC RANK
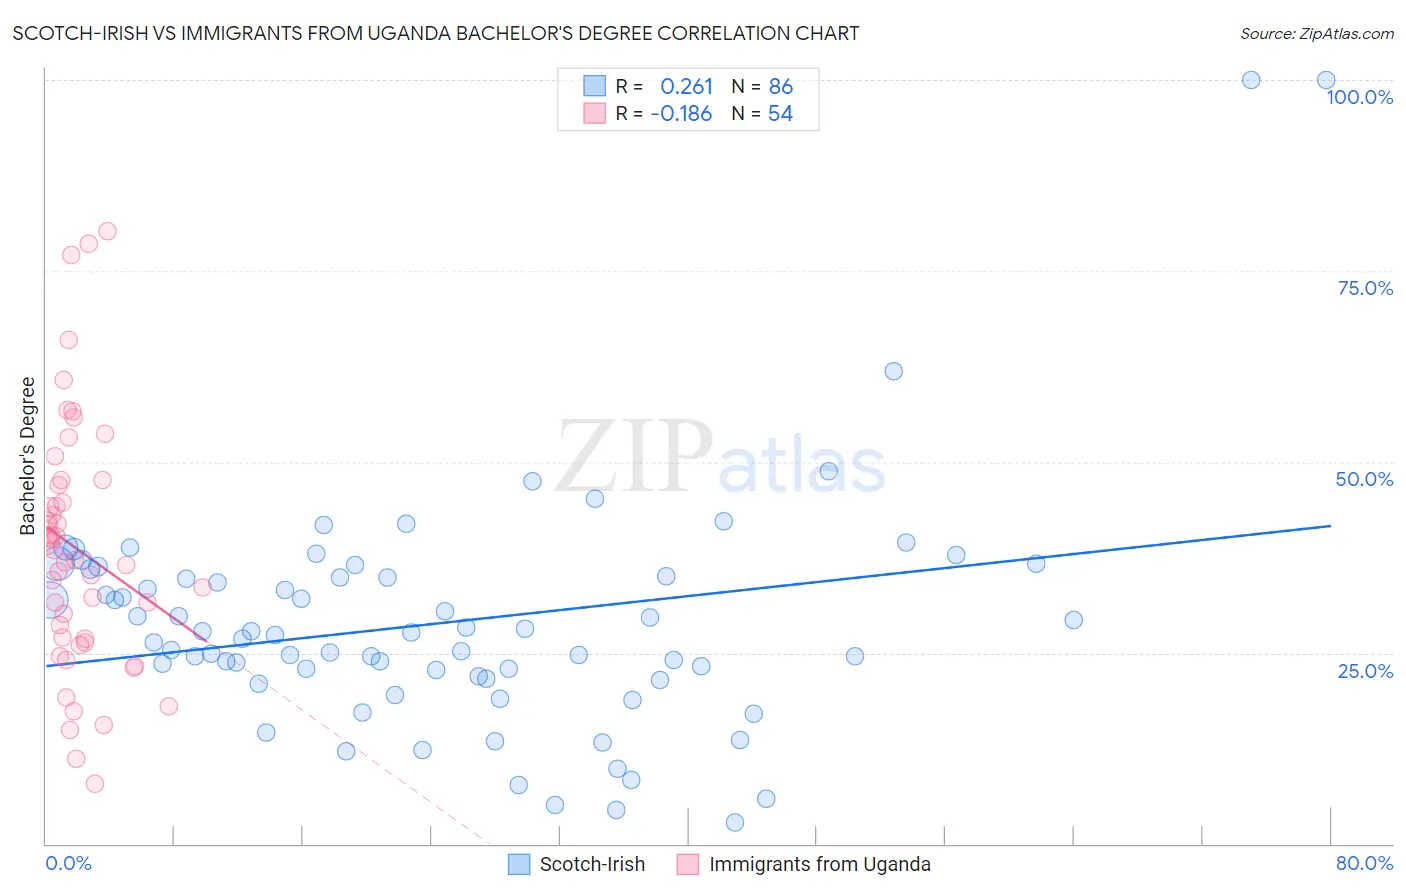
Scotch-Irish vs Immigrants from Uganda Bachelor's Degree Correlation Chart
The statistical analysis conducted on geographies consisting of 548,685,901 people shows a weak positive correlation between the proportion of Scotch-Irish and percentage of population with at least bachelor's degree education in the United States with a correlation coefficient (R) of 0.261 and weighted average of 36.4%. Similarly, the statistical analysis conducted on geographies consisting of 125,980,358 people shows a poor negative correlation between the proportion of Immigrants from Uganda and percentage of population with at least bachelor's degree education in the United States with a correlation coefficient (R) of -0.186 and weighted average of 40.7%, a difference of 11.6%.
Bachelor's Degree Correlation Summary
| Measurement | Scotch-Irish | Immigrants from Uganda |
| Minimum | 2.9% | 7.9% |
| Maximum | 100.0% | 80.2% |
| Range | 97.1% | 72.3% |
| Mean | 28.9% | 38.5% |
| Median | 27.5% | 37.9% |
| Interquartile 25% (IQ1) | 21.9% | 26.9% |
| Interquartile 75% (IQ3) | 35.1% | 47.0% |
| Interquartile Range (IQR) | 13.2% | 20.2% |
| Standard Deviation (Sample) | 15.4% | 16.2% |
| Standard Deviation (Population) | 15.3% | 16.0% |
Similar Demographics by Bachelor's Degree
Demographics Similar to Scotch-Irish by Bachelor's Degree
In terms of bachelor's degree, the demographic groups most similar to Scotch-Irish are French (36.5%, a difference of 0.050%), Panamanian (36.5%, a difference of 0.080%), Immigrants from Philippines (36.4%, a difference of 0.080%), Immigrants from Thailand (36.5%, a difference of 0.18%), and Immigrants from Middle Africa (36.6%, a difference of 0.38%).
| Demographics | Rating | Rank | Bachelor's Degree |
| Immigrants | Immigrants | 22.8 /100 | #204 | Fair 36.7% |
| Finns | 22.2 /100 | #205 | Fair 36.7% |
| Spaniards | 21.2 /100 | #206 | Fair 36.6% |
| Immigrants | Middle Africa | 20.6 /100 | #207 | Fair 36.6% |
| Immigrants | Thailand | 19.4 /100 | #208 | Poor 36.5% |
| Panamanians | 18.8 /100 | #209 | Poor 36.5% |
| French | 18.6 /100 | #210 | Poor 36.5% |
| Scotch-Irish | 18.3 /100 | #211 | Poor 36.4% |
| Immigrants | Philippines | 17.8 /100 | #212 | Poor 36.4% |
| Immigrants | Panama | 14.2 /100 | #213 | Poor 36.2% |
| Germans | 13.9 /100 | #214 | Poor 36.1% |
| Immigrants | Western Africa | 13.8 /100 | #215 | Poor 36.1% |
| Barbadians | 13.5 /100 | #216 | Poor 36.1% |
| German Russians | 10.2 /100 | #217 | Poor 35.8% |
| Sub-Saharan Africans | 9.8 /100 | #218 | Tragic 35.8% |
Demographics Similar to Immigrants from Uganda by Bachelor's Degree
In terms of bachelor's degree, the demographic groups most similar to Immigrants from Uganda are Palestinian (40.7%, a difference of 0.050%), Austrian (40.6%, a difference of 0.10%), Croatian (40.6%, a difference of 0.12%), Afghan (40.8%, a difference of 0.29%), and Brazilian (40.8%, a difference of 0.32%).
| Demographics | Rating | Rank | Bachelor's Degree |
| Arabs | 96.6 /100 | #109 | Exceptional 40.9% |
| Albanians | 96.5 /100 | #110 | Exceptional 40.9% |
| Immigrants | Chile | 96.4 /100 | #111 | Exceptional 40.8% |
| Ugandans | 96.3 /100 | #112 | Exceptional 40.8% |
| Brazilians | 96.3 /100 | #113 | Exceptional 40.8% |
| Afghans | 96.2 /100 | #114 | Exceptional 40.8% |
| Palestinians | 95.8 /100 | #115 | Exceptional 40.7% |
| Immigrants | Uganda | 95.7 /100 | #116 | Exceptional 40.7% |
| Austrians | 95.5 /100 | #117 | Exceptional 40.6% |
| Croatians | 95.5 /100 | #118 | Exceptional 40.6% |
| Immigrants | Syria | 94.9 /100 | #119 | Exceptional 40.5% |
| Venezuelans | 94.7 /100 | #120 | Exceptional 40.5% |
| Moroccans | 94.6 /100 | #121 | Exceptional 40.5% |
| Immigrants | Albania | 94.4 /100 | #122 | Exceptional 40.4% |
| Lebanese | 94.3 /100 | #123 | Exceptional 40.4% |