Scotch-Irish vs Guamanian/Chamorro Bachelor's Degree
COMPARE
Scotch-Irish
Guamanian/Chamorro
Bachelor's Degree
Bachelor's Degree Comparison
Scotch-Irish
Guamanians/Chamorros
36.4%
BACHELOR'S DEGREE
18.3/ 100
METRIC RATING
211th/ 347
METRIC RANK
34.6%
BACHELOR'S DEGREE
3.0/ 100
METRIC RATING
234th/ 347
METRIC RANK
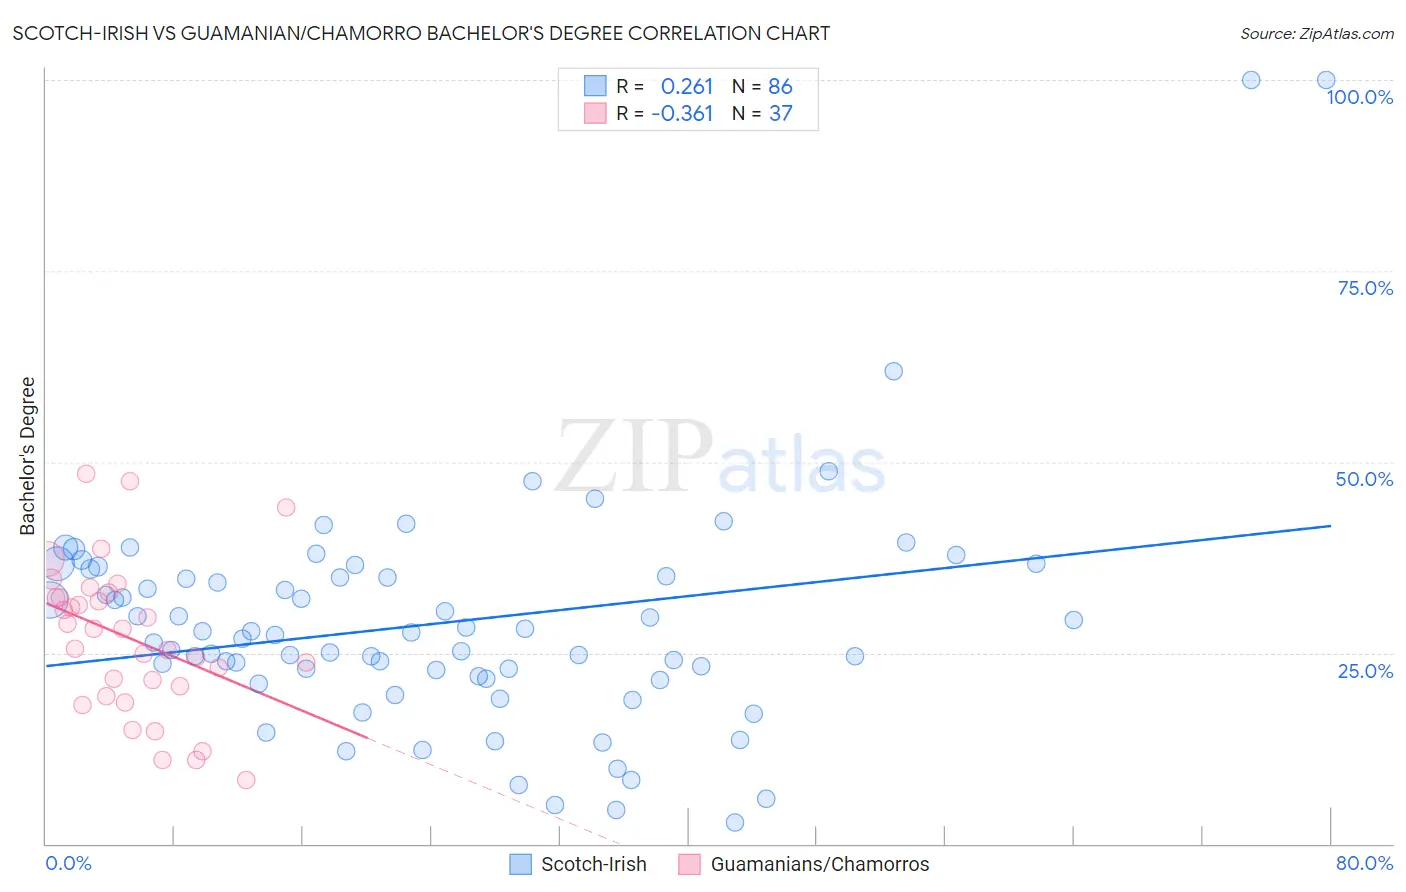
Scotch-Irish vs Guamanian/Chamorro Bachelor's Degree Correlation Chart
The statistical analysis conducted on geographies consisting of 548,685,901 people shows a weak positive correlation between the proportion of Scotch-Irish and percentage of population with at least bachelor's degree education in the United States with a correlation coefficient (R) of 0.261 and weighted average of 36.4%. Similarly, the statistical analysis conducted on geographies consisting of 221,963,631 people shows a mild negative correlation between the proportion of Guamanians/Chamorros and percentage of population with at least bachelor's degree education in the United States with a correlation coefficient (R) of -0.361 and weighted average of 34.6%, a difference of 5.2%.
Bachelor's Degree Correlation Summary
| Measurement | Scotch-Irish | Guamanian/Chamorro |
| Minimum | 2.9% | 8.3% |
| Maximum | 100.0% | 48.4% |
| Range | 97.1% | 40.0% |
| Mean | 28.9% | 26.9% |
| Median | 27.5% | 28.2% |
| Interquartile 25% (IQ1) | 21.9% | 20.0% |
| Interquartile 75% (IQ3) | 35.1% | 32.6% |
| Interquartile Range (IQR) | 13.2% | 12.7% |
| Standard Deviation (Sample) | 15.4% | 9.8% |
| Standard Deviation (Population) | 15.3% | 9.7% |
Similar Demographics by Bachelor's Degree
Demographics Similar to Scotch-Irish by Bachelor's Degree
In terms of bachelor's degree, the demographic groups most similar to Scotch-Irish are French (36.5%, a difference of 0.050%), Panamanian (36.5%, a difference of 0.080%), Immigrants from Philippines (36.4%, a difference of 0.080%), Immigrants from Thailand (36.5%, a difference of 0.18%), and Immigrants from Middle Africa (36.6%, a difference of 0.38%).
| Demographics | Rating | Rank | Bachelor's Degree |
| Immigrants | Immigrants | 22.8 /100 | #204 | Fair 36.7% |
| Finns | 22.2 /100 | #205 | Fair 36.7% |
| Spaniards | 21.2 /100 | #206 | Fair 36.6% |
| Immigrants | Middle Africa | 20.6 /100 | #207 | Fair 36.6% |
| Immigrants | Thailand | 19.4 /100 | #208 | Poor 36.5% |
| Panamanians | 18.8 /100 | #209 | Poor 36.5% |
| French | 18.6 /100 | #210 | Poor 36.5% |
| Scotch-Irish | 18.3 /100 | #211 | Poor 36.4% |
| Immigrants | Philippines | 17.8 /100 | #212 | Poor 36.4% |
| Immigrants | Panama | 14.2 /100 | #213 | Poor 36.2% |
| Germans | 13.9 /100 | #214 | Poor 36.1% |
| Immigrants | Western Africa | 13.8 /100 | #215 | Poor 36.1% |
| Barbadians | 13.5 /100 | #216 | Poor 36.1% |
| German Russians | 10.2 /100 | #217 | Poor 35.8% |
| Sub-Saharan Africans | 9.8 /100 | #218 | Tragic 35.8% |
Demographics Similar to Guamanians/Chamorros by Bachelor's Degree
In terms of bachelor's degree, the demographic groups most similar to Guamanians/Chamorros are Immigrants from West Indies (34.6%, a difference of 0.090%), Liberian (34.6%, a difference of 0.20%), Immigrants from Ecuador (34.7%, a difference of 0.22%), Tlingit-Haida (34.6%, a difference of 0.24%), and Hmong (34.8%, a difference of 0.32%).
| Demographics | Rating | Rank | Bachelor's Degree |
| Ecuadorians | 6.6 /100 | #227 | Tragic 35.4% |
| Immigrants | Trinidad and Tobago | 6.0 /100 | #228 | Tragic 35.3% |
| Whites/Caucasians | 5.9 /100 | #229 | Tragic 35.3% |
| Immigrants | Grenada | 4.3 /100 | #230 | Tragic 35.0% |
| Immigrants | St. Vincent and the Grenadines | 4.3 /100 | #231 | Tragic 35.0% |
| Hmong | 3.4 /100 | #232 | Tragic 34.8% |
| Immigrants | Ecuador | 3.3 /100 | #233 | Tragic 34.7% |
| Guamanians/Chamorros | 3.0 /100 | #234 | Tragic 34.6% |
| Immigrants | West Indies | 2.9 /100 | #235 | Tragic 34.6% |
| Liberians | 2.8 /100 | #236 | Tragic 34.6% |
| Tlingit-Haida | 2.8 /100 | #237 | Tragic 34.6% |
| Guyanese | 2.5 /100 | #238 | Tragic 34.5% |
| British West Indians | 2.5 /100 | #239 | Tragic 34.5% |
| Tongans | 2.0 /100 | #240 | Tragic 34.3% |
| Immigrants | Cambodia | 1.9 /100 | #241 | Tragic 34.2% |