Scotch-Irish vs Immigrants from Micronesia Male Poverty
COMPARE
Scotch-Irish
Immigrants from Micronesia
Male Poverty
Male Poverty Comparison
Scotch-Irish
Immigrants from Micronesia
11.0%
MALE POVERTY
63.7/ 100
METRIC RATING
157th/ 347
METRIC RANK
12.2%
MALE POVERTY
2.1/ 100
METRIC RATING
223rd/ 347
METRIC RANK
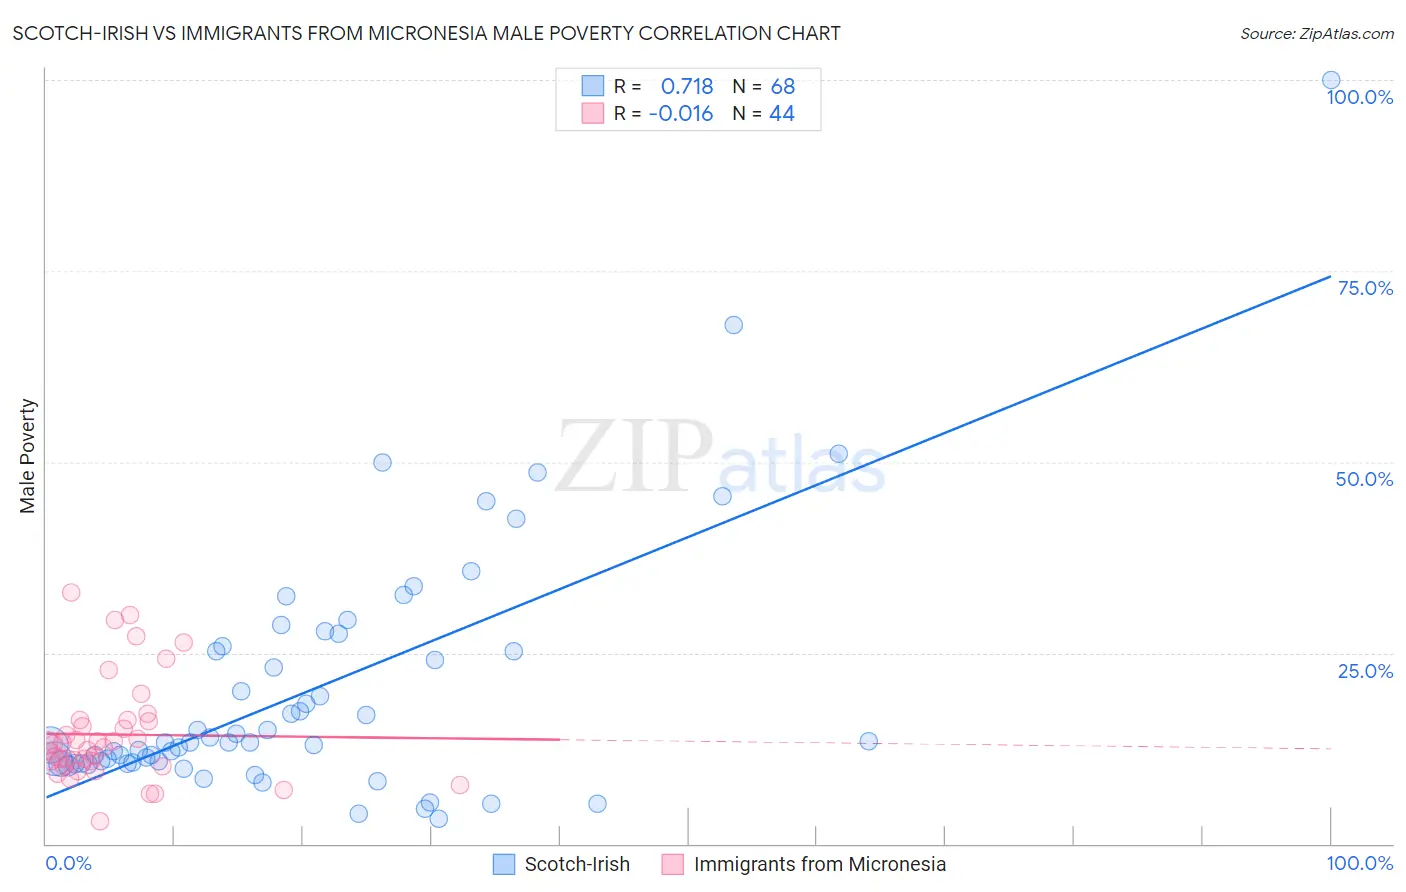
Scotch-Irish vs Immigrants from Micronesia Male Poverty Correlation Chart
The statistical analysis conducted on geographies consisting of 547,595,685 people shows a strong positive correlation between the proportion of Scotch-Irish and poverty level among males in the United States with a correlation coefficient (R) of 0.718 and weighted average of 11.0%. Similarly, the statistical analysis conducted on geographies consisting of 61,601,312 people shows no correlation between the proportion of Immigrants from Micronesia and poverty level among males in the United States with a correlation coefficient (R) of -0.016 and weighted average of 12.2%, a difference of 10.9%.
Male Poverty Correlation Summary
| Measurement | Scotch-Irish | Immigrants from Micronesia |
| Minimum | 3.2% | 3.0% |
| Maximum | 100.0% | 32.9% |
| Range | 96.8% | 29.9% |
| Mean | 20.1% | 14.3% |
| Median | 13.3% | 12.8% |
| Interquartile 25% (IQ1) | 10.6% | 10.5% |
| Interquartile 75% (IQ3) | 25.5% | 16.1% |
| Interquartile Range (IQR) | 14.9% | 5.6% |
| Standard Deviation (Sample) | 16.5% | 6.7% |
| Standard Deviation (Population) | 16.4% | 6.6% |
Similar Demographics by Male Poverty
Demographics Similar to Scotch-Irish by Male Poverty
In terms of male poverty, the demographic groups most similar to Scotch-Irish are Costa Rican (11.0%, a difference of 0.020%), Colombian (11.0%, a difference of 0.080%), Taiwanese (11.0%, a difference of 0.10%), Immigrants from Malaysia (11.0%, a difference of 0.11%), and Immigrants from Kazakhstan (11.0%, a difference of 0.12%).
| Demographics | Rating | Rank | Male Poverty |
| Guamanians/Chamorros | 67.6 /100 | #150 | Good 11.0% |
| Venezuelans | 67.4 /100 | #151 | Good 11.0% |
| Immigrants | Nepal | 67.3 /100 | #152 | Good 11.0% |
| Immigrants | Bosnia and Herzegovina | 65.2 /100 | #153 | Good 11.0% |
| Immigrants | Kazakhstan | 64.8 /100 | #154 | Good 11.0% |
| Immigrants | Malaysia | 64.7 /100 | #155 | Good 11.0% |
| Costa Ricans | 63.9 /100 | #156 | Good 11.0% |
| Scotch-Irish | 63.7 /100 | #157 | Good 11.0% |
| Colombians | 63.0 /100 | #158 | Good 11.0% |
| Taiwanese | 62.7 /100 | #159 | Good 11.0% |
| Soviet Union | 60.3 /100 | #160 | Good 11.1% |
| Immigrants | Northern Africa | 59.7 /100 | #161 | Average 11.1% |
| Immigrants | Chile | 57.4 /100 | #162 | Average 11.1% |
| Whites/Caucasians | 56.7 /100 | #163 | Average 11.1% |
| Ethiopians | 56.7 /100 | #164 | Average 11.1% |
Demographics Similar to Immigrants from Micronesia by Male Poverty
In terms of male poverty, the demographic groups most similar to Immigrants from Micronesia are Immigrants from Africa (12.2%, a difference of 0.010%), Ugandan (12.2%, a difference of 0.040%), Immigrants from Eritrea (12.2%, a difference of 0.25%), Bermudan (12.2%, a difference of 0.26%), and German Russian (12.2%, a difference of 0.33%).
| Demographics | Rating | Rank | Male Poverty |
| Immigrants | Cambodia | 2.5 /100 | #216 | Tragic 12.2% |
| Immigrants | Thailand | 2.5 /100 | #217 | Tragic 12.2% |
| German Russians | 2.5 /100 | #218 | Tragic 12.2% |
| Bermudans | 2.4 /100 | #219 | Tragic 12.2% |
| Immigrants | Eritrea | 2.4 /100 | #220 | Tragic 12.2% |
| Ugandans | 2.2 /100 | #221 | Tragic 12.2% |
| Immigrants | Africa | 2.1 /100 | #222 | Tragic 12.2% |
| Immigrants | Micronesia | 2.1 /100 | #223 | Tragic 12.2% |
| Immigrants | Nigeria | 1.6 /100 | #224 | Tragic 12.3% |
| Osage | 1.5 /100 | #225 | Tragic 12.3% |
| Nigerians | 1.4 /100 | #226 | Tragic 12.3% |
| Alaska Natives | 1.4 /100 | #227 | Tragic 12.4% |
| Alsatians | 1.3 /100 | #228 | Tragic 12.4% |
| Cubans | 1.3 /100 | #229 | Tragic 12.4% |
| Marshallese | 0.8 /100 | #230 | Tragic 12.5% |