Estonian vs Immigrants from Kuwait 10th Grade
COMPARE
Estonian
Immigrants from Kuwait
10th Grade
10th Grade Comparison
Estonians
Immigrants from Kuwait
95.3%
10TH GRADE
99.9/ 100
METRIC RATING
35th/ 347
METRIC RANK
94.4%
10TH GRADE
96.8/ 100
METRIC RATING
112th/ 347
METRIC RANK
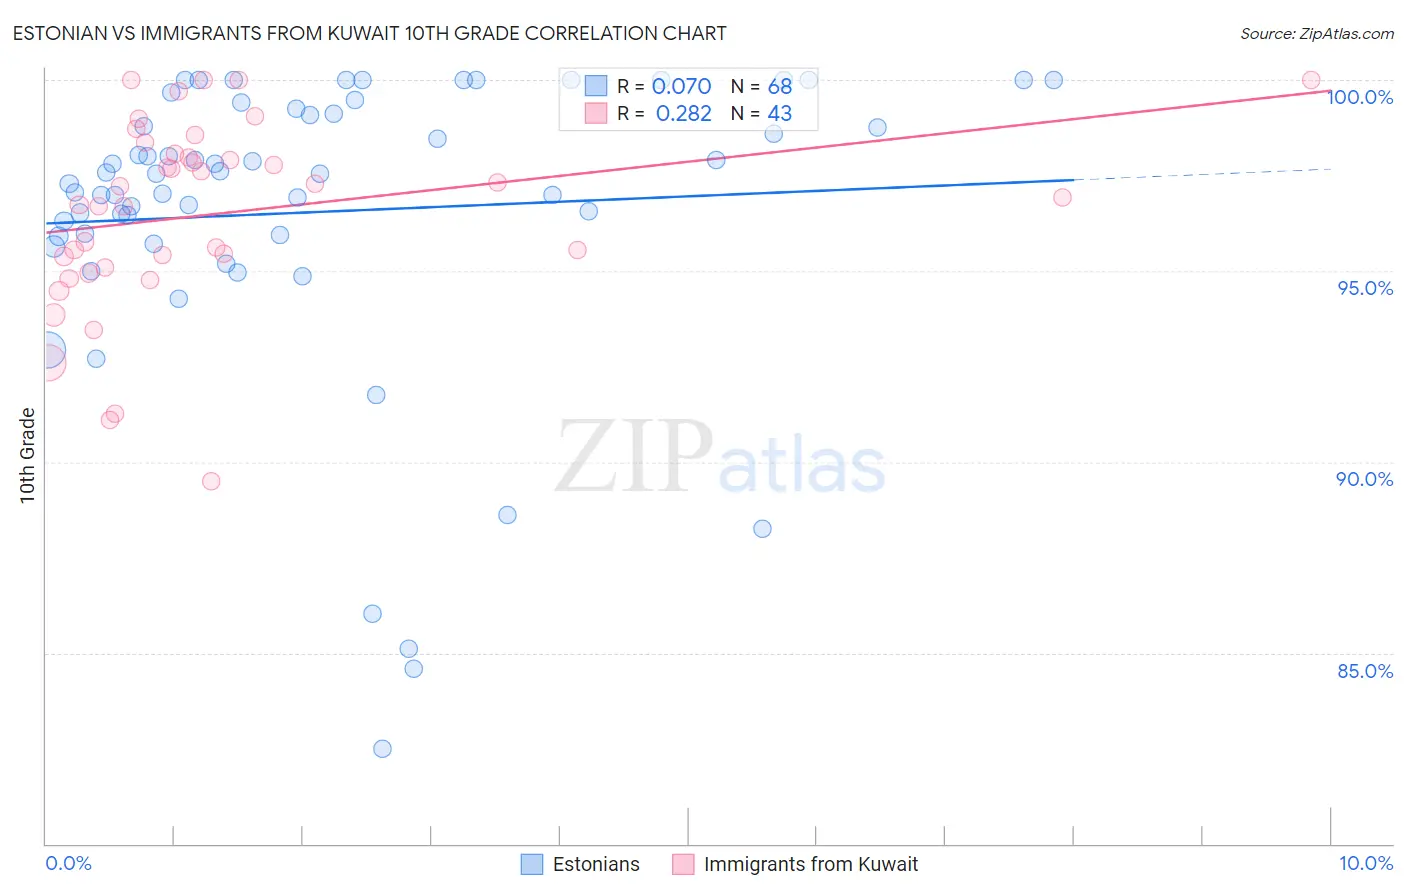
Estonian vs Immigrants from Kuwait 10th Grade Correlation Chart
The statistical analysis conducted on geographies consisting of 123,528,404 people shows a slight positive correlation between the proportion of Estonians and percentage of population with at least 10th grade education in the United States with a correlation coefficient (R) of 0.070 and weighted average of 95.3%. Similarly, the statistical analysis conducted on geographies consisting of 136,917,085 people shows a weak positive correlation between the proportion of Immigrants from Kuwait and percentage of population with at least 10th grade education in the United States with a correlation coefficient (R) of 0.282 and weighted average of 94.4%, a difference of 0.92%.
10th Grade Correlation Summary
| Measurement | Estonian | Immigrants from Kuwait |
| Minimum | 82.5% | 89.5% |
| Maximum | 100.0% | 100.0% |
| Range | 17.5% | 10.5% |
| Mean | 96.5% | 96.5% |
| Median | 97.5% | 96.9% |
| Interquartile 25% (IQ1) | 95.9% | 95.1% |
| Interquartile 75% (IQ3) | 99.2% | 98.1% |
| Interquartile Range (IQR) | 3.3% | 3.0% |
| Standard Deviation (Sample) | 3.9% | 2.5% |
| Standard Deviation (Population) | 3.9% | 2.5% |
Similar Demographics by 10th Grade
Demographics Similar to Estonians by 10th Grade
In terms of 10th grade, the demographic groups most similar to Estonians are British (95.3%, a difference of 0.010%), Immigrants from India (95.3%, a difference of 0.010%), Iranian (95.3%, a difference of 0.020%), Hungarian (95.3%, a difference of 0.020%), and French (95.3%, a difference of 0.020%).
| Demographics | Rating | Rank | 10th Grade |
| Luxembourgers | 100.0 /100 | #28 | Exceptional 95.4% |
| Bulgarians | 100.0 /100 | #29 | Exceptional 95.4% |
| Belgians | 100.0 /100 | #30 | Exceptional 95.4% |
| Iranians | 100.0 /100 | #31 | Exceptional 95.3% |
| Hungarians | 100.0 /100 | #32 | Exceptional 95.3% |
| French | 100.0 /100 | #33 | Exceptional 95.3% |
| British | 99.9 /100 | #34 | Exceptional 95.3% |
| Estonians | 99.9 /100 | #35 | Exceptional 95.3% |
| Immigrants | India | 99.9 /100 | #36 | Exceptional 95.3% |
| French Canadians | 99.9 /100 | #37 | Exceptional 95.3% |
| Northern Europeans | 99.9 /100 | #38 | Exceptional 95.3% |
| Immigrants | Scotland | 99.9 /100 | #39 | Exceptional 95.2% |
| Scotch-Irish | 99.9 /100 | #40 | Exceptional 95.2% |
| Russians | 99.9 /100 | #41 | Exceptional 95.2% |
| Slavs | 99.9 /100 | #42 | Exceptional 95.2% |
Demographics Similar to Immigrants from Kuwait by 10th Grade
In terms of 10th grade, the demographic groups most similar to Immigrants from Kuwait are Immigrants from Zimbabwe (94.4%, a difference of 0.010%), Palestinian (94.4%, a difference of 0.020%), Burmese (94.5%, a difference of 0.030%), German Russian (94.4%, a difference of 0.030%), and Delaware (94.4%, a difference of 0.030%).
| Demographics | Rating | Rank | 10th Grade |
| Immigrants | Turkey | 97.4 /100 | #105 | Exceptional 94.5% |
| Immigrants | Serbia | 97.4 /100 | #106 | Exceptional 94.5% |
| Immigrants | Croatia | 97.4 /100 | #107 | Exceptional 94.5% |
| Immigrants | North Macedonia | 97.2 /100 | #108 | Exceptional 94.5% |
| Immigrants | Norway | 97.2 /100 | #109 | Exceptional 94.5% |
| Burmese | 97.1 /100 | #110 | Exceptional 94.5% |
| Immigrants | Zimbabwe | 96.8 /100 | #111 | Exceptional 94.4% |
| Immigrants | Kuwait | 96.8 /100 | #112 | Exceptional 94.4% |
| Palestinians | 96.5 /100 | #113 | Exceptional 94.4% |
| German Russians | 96.3 /100 | #114 | Exceptional 94.4% |
| Delaware | 96.3 /100 | #115 | Exceptional 94.4% |
| Sioux | 96.2 /100 | #116 | Exceptional 94.4% |
| Immigrants | Hungary | 95.8 /100 | #117 | Exceptional 94.4% |
| Jordanians | 95.6 /100 | #118 | Exceptional 94.4% |
| Immigrants | Israel | 95.4 /100 | #119 | Exceptional 94.4% |