Immigrants from England vs Immigrants from Kuwait 10th Grade
COMPARE
Immigrants from England
Immigrants from Kuwait
10th Grade
10th Grade Comparison
Immigrants from England
Immigrants from Kuwait
94.9%
10TH GRADE
99.6/ 100
METRIC RATING
69th/ 347
METRIC RANK
94.4%
10TH GRADE
96.8/ 100
METRIC RATING
112th/ 347
METRIC RANK
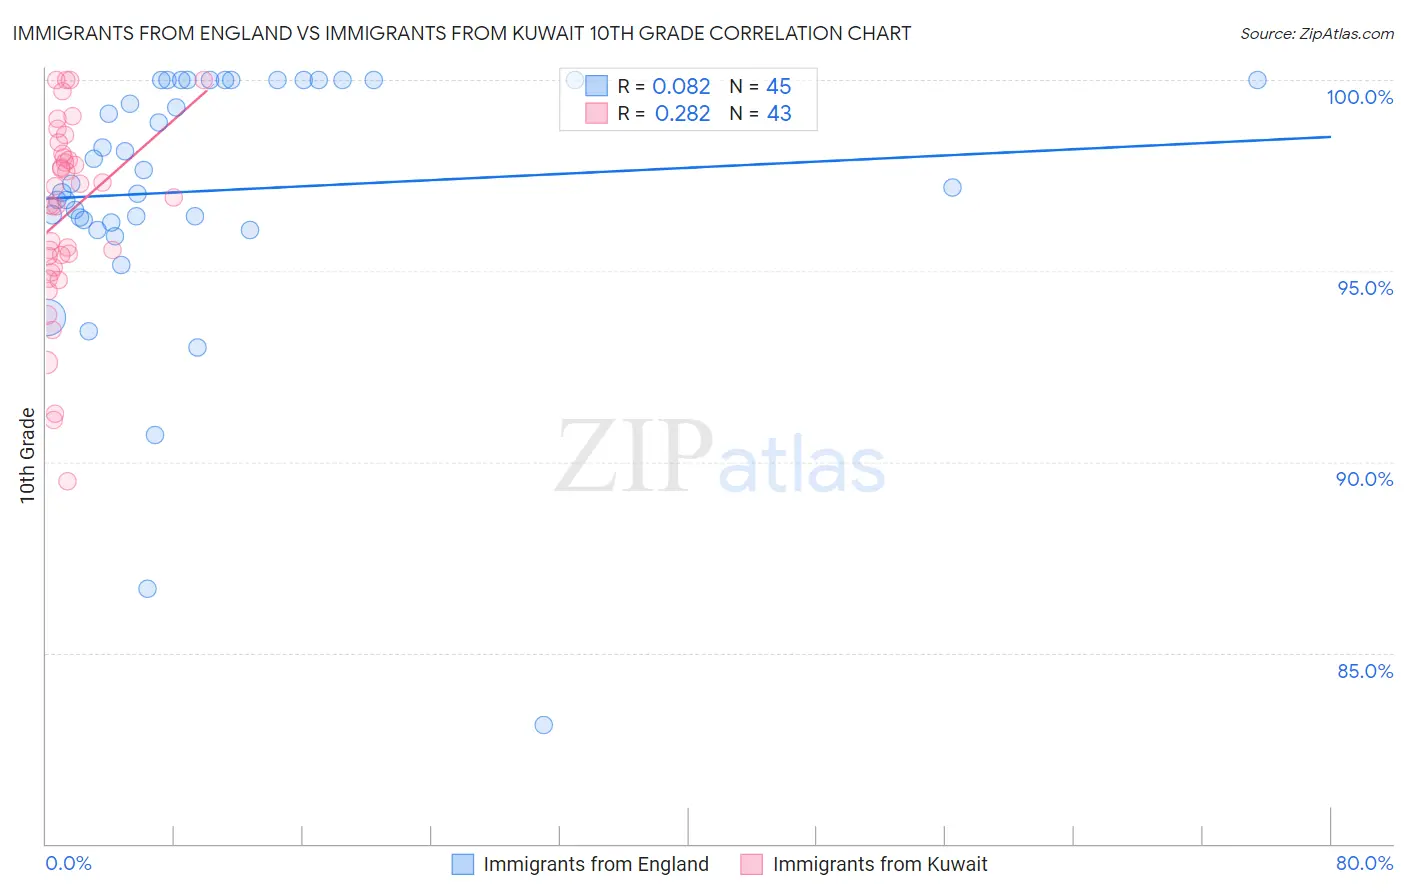
Immigrants from England vs Immigrants from Kuwait 10th Grade Correlation Chart
The statistical analysis conducted on geographies consisting of 391,897,374 people shows a slight positive correlation between the proportion of Immigrants from England and percentage of population with at least 10th grade education in the United States with a correlation coefficient (R) of 0.082 and weighted average of 94.9%. Similarly, the statistical analysis conducted on geographies consisting of 136,917,085 people shows a weak positive correlation between the proportion of Immigrants from Kuwait and percentage of population with at least 10th grade education in the United States with a correlation coefficient (R) of 0.282 and weighted average of 94.4%, a difference of 0.49%.
10th Grade Correlation Summary
| Measurement | Immigrants from England | Immigrants from Kuwait |
| Minimum | 83.1% | 89.5% |
| Maximum | 100.0% | 100.0% |
| Range | 16.9% | 10.5% |
| Mean | 97.1% | 96.5% |
| Median | 97.3% | 96.9% |
| Interquartile 25% (IQ1) | 96.3% | 95.1% |
| Interquartile 75% (IQ3) | 100.0% | 98.1% |
| Interquartile Range (IQR) | 3.7% | 3.0% |
| Standard Deviation (Sample) | 3.5% | 2.5% |
| Standard Deviation (Population) | 3.5% | 2.5% |
Similar Demographics by 10th Grade
Demographics Similar to Immigrants from England by 10th Grade
In terms of 10th grade, the demographic groups most similar to Immigrants from England are Immigrants from Belgium (94.9%, a difference of 0.010%), Zimbabwean (94.9%, a difference of 0.010%), Alaska Native (94.9%, a difference of 0.010%), Immigrants from Australia (94.9%, a difference of 0.020%), and Immigrants from Netherlands (94.9%, a difference of 0.020%).
| Demographics | Rating | Rank | 10th Grade |
| Thais | 99.8 /100 | #62 | Exceptional 95.0% |
| Immigrants | Singapore | 99.8 /100 | #63 | Exceptional 95.0% |
| Native Hawaiians | 99.7 /100 | #64 | Exceptional 95.0% |
| Turks | 99.7 /100 | #65 | Exceptional 95.0% |
| Immigrants | Australia | 99.7 /100 | #66 | Exceptional 94.9% |
| Immigrants | Netherlands | 99.7 /100 | #67 | Exceptional 94.9% |
| Immigrants | Belgium | 99.7 /100 | #68 | Exceptional 94.9% |
| Immigrants | England | 99.6 /100 | #69 | Exceptional 94.9% |
| Zimbabweans | 99.6 /100 | #70 | Exceptional 94.9% |
| Alaska Natives | 99.6 /100 | #71 | Exceptional 94.9% |
| Immigrants | Sweden | 99.6 /100 | #72 | Exceptional 94.9% |
| Bhutanese | 99.6 /100 | #73 | Exceptional 94.9% |
| Canadians | 99.6 /100 | #74 | Exceptional 94.9% |
| Okinawans | 99.5 /100 | #75 | Exceptional 94.8% |
| Romanians | 99.5 /100 | #76 | Exceptional 94.8% |
Demographics Similar to Immigrants from Kuwait by 10th Grade
In terms of 10th grade, the demographic groups most similar to Immigrants from Kuwait are Immigrants from Zimbabwe (94.4%, a difference of 0.010%), Palestinian (94.4%, a difference of 0.020%), Burmese (94.5%, a difference of 0.030%), German Russian (94.4%, a difference of 0.030%), and Delaware (94.4%, a difference of 0.030%).
| Demographics | Rating | Rank | 10th Grade |
| Immigrants | Turkey | 97.4 /100 | #105 | Exceptional 94.5% |
| Immigrants | Serbia | 97.4 /100 | #106 | Exceptional 94.5% |
| Immigrants | Croatia | 97.4 /100 | #107 | Exceptional 94.5% |
| Immigrants | North Macedonia | 97.2 /100 | #108 | Exceptional 94.5% |
| Immigrants | Norway | 97.2 /100 | #109 | Exceptional 94.5% |
| Burmese | 97.1 /100 | #110 | Exceptional 94.5% |
| Immigrants | Zimbabwe | 96.8 /100 | #111 | Exceptional 94.4% |
| Immigrants | Kuwait | 96.8 /100 | #112 | Exceptional 94.4% |
| Palestinians | 96.5 /100 | #113 | Exceptional 94.4% |
| German Russians | 96.3 /100 | #114 | Exceptional 94.4% |
| Delaware | 96.3 /100 | #115 | Exceptional 94.4% |
| Sioux | 96.2 /100 | #116 | Exceptional 94.4% |
| Immigrants | Hungary | 95.8 /100 | #117 | Exceptional 94.4% |
| Jordanians | 95.6 /100 | #118 | Exceptional 94.4% |
| Immigrants | Israel | 95.4 /100 | #119 | Exceptional 94.4% |