Guyanese vs Immigrants from Kuwait 10th Grade

COMPARE

Guyanese
Race
Ancestry
AfghanAfricanAlaska NativeAlaskan AthabascanAlbanianAleutAlsatianAmericanApacheArabArapahoArgentineanArmenianAssyrian/Chaldean/SyriacAustralianAustrianBahamianBangladeshiBarbadianBasqueBelgianBelizeanBermudanBhutaneseBlackfeetBolivianBrazilianBritishBritish West IndianBulgarianBurmeseCajunCambodianCanadianCape VerdeanCarpatho RusynCelticCentral AmericanCentral American IndianCherokeeCheyenneChickasawChileanChineseChippewaChoctawColombianColvilleComancheCosta RicanCreeCreekCroatianCrowCubanCypriotCzechCzechoslovakianDanishDelawareDominicanDutchDutch West IndianEastern EuropeanEcuadorianEgyptianEnglishEstonianEthiopianEuropeanFijianFilipinoFinnishFrenchFrench American IndianFrench CanadianGermanGerman RussianGhanaianGreekGuamanian/ChamorroGuatemalanGuyaneseHaitianHmongHonduranHopiHoumaHungarianIcelanderIndian (Asian)IndonesianInupiatIranianIraqiIrishIroquoisIsraeliItalianJamaicanJapaneseJordanianKenyanKiowaKoreanLaotianLatvianLebaneseLiberianLithuanianLumbeeLuxembourgerMacedonianMalaysianMalteseMarshalleseMenomineeMexicanMexican American IndianMongolianMoroccanNative HawaiianNavajoNepaleseNew ZealanderNicaraguanNigerianNorthern EuropeanNorwegianOkinawanOsageOttawaPaiutePakistaniPalestinianPanamanianParaguayanPennsylvania GermanPeruvianPimaPolishPortuguesePotawatomiPuebloPuerto RicanPuget Sound SalishRomanianRussianSalvadoranSamoanScandinavianScotch-IrishScottishSeminoleSenegaleseSerbianShoshoneSierra LeoneanSiouxSlavicSlovakSloveneSomaliSouth AfricanSouth AmericanSouth American IndianSoviet UnionSpaniardSpanishSpanish AmericanSpanish American IndianSri LankanSubsaharan AfricanSudaneseSwedishSwissSyrianTaiwaneseThaiTlingit-HaidaTohono O'OdhamTonganTrinidadian and TobagonianTsimshianTurkishU.S. Virgin IslanderUgandanUkrainianUruguayanUteVenezuelanVietnameseWelshWest IndianYakamaYaquiYugoslavianYumanYup'ikZimbabwean
Immigration
NonimmigrantsImmigrantsAfghanistanAfricaAlbaniaArgentinaArmeniaAsiaAustraliaAustriaBahamasBangladeshBarbadosBelarusBelgiumBelizeBoliviaBosnia and HerzegovinaBrazilBulgariaBurma/MyanmarCabo VerdeCambodiaCameroonCanadaCaribbeanCentral AmericaChileChinaColombiaCongoCosta RicaCroatiaCubaCzechoslovakiaDenmarkDominicaDominican RepublicEastern AfricaEastern AsiaEastern EuropeEcuadorEgyptEl SalvadorEnglandEritreaEthiopiaEuropeFijiFranceGermanyGhanaGreeceGrenadaGuatemalaGuyanaHaitiHondurasHong KongHungaryIndiaIndonesiaIranIraqIrelandIsraelItalyJamaicaJapanJordanKazakhstanKenyaKoreaLaosLatin AmericaLatviaLebanonLiberiaLithuaniaMalaysiaMexicoMicronesiaMiddle AfricaMoldovaMoroccoNepalNetherlandsNicaraguaNigeriaNorth AmericaNorth MacedoniaNorthern AfricaNorthern EuropeNorwayOceaniaPakistanPanamaPeruPhilippinesPolandPortugalRomaniaRussiaSaudi ArabiaScotlandSenegalSerbiaSierra LeoneSingaporeSomaliaSouth AfricaSouth AmericaSouth Central AsiaSouth Eastern AsiaSouthern EuropeSpainSri LankaSt. Vincent and the GrenadinesSudanSwedenSwitzerlandSyriaTaiwanThailandTrinidad and TobagoTurkeyUgandaUkraineUruguayUzbekistanVenezuelaVietnamWest IndiesWestern AfricaWestern AsiaWestern EuropeYemenZaireZimbabweAzores
Immigrants from Kuwait
Race
Ancestry
AfghanAfricanAlaska NativeAlaskan AthabascanAlbanianAleutAlsatianAmericanApacheArabArapahoArgentineanArmenianAssyrian/Chaldean/SyriacAustralianAustrianBahamianBangladeshiBarbadianBasqueBelgianBelizeanBermudanBhutaneseBlackfeetBolivianBrazilianBritishBritish West IndianBulgarianBurmeseCajunCambodianCanadianCape VerdeanCarpatho RusynCelticCentral AmericanCentral American IndianCherokeeCheyenneChickasawChileanChineseChippewaChoctawColombianColvilleComancheCosta RicanCreeCreekCroatianCrowCubanCypriotCzechCzechoslovakianDanishDelawareDominicanDutchDutch West IndianEastern EuropeanEcuadorianEgyptianEnglishEstonianEthiopianEuropeanFijianFilipinoFinnishFrenchFrench American IndianFrench CanadianGermanGerman RussianGhanaianGreekGuamanian/ChamorroGuatemalanHaitianHmongHonduranHopiHoumaHungarianIcelanderIndian (Asian)IndonesianInupiatIranianIraqiIrishIroquoisIsraeliItalianJamaicanJapaneseJordanianKenyanKiowaKoreanLaotianLatvianLebaneseLiberianLithuanianLumbeeLuxembourgerMacedonianMalaysianMalteseMarshalleseMenomineeMexicanMexican American IndianMongolianMoroccanNative HawaiianNavajoNepaleseNew ZealanderNicaraguanNigerianNorthern EuropeanNorwegianOkinawanOsageOttawaPaiutePakistaniPalestinianPanamanianParaguayanPennsylvania GermanPeruvianPimaPolishPortuguesePotawatomiPuebloPuerto RicanPuget Sound SalishRomanianRussianSalvadoranSamoanScandinavianScotch-IrishScottishSeminoleSenegaleseSerbianShoshoneSierra LeoneanSiouxSlavicSlovakSloveneSomaliSouth AfricanSouth AmericanSouth American IndianSoviet UnionSpaniardSpanishSpanish AmericanSpanish American IndianSri LankanSubsaharan AfricanSudaneseSwedishSwissSyrianTaiwaneseThaiTlingit-HaidaTohono O'OdhamTonganTrinidadian and TobagonianTsimshianTurkishU.S. Virgin IslanderUgandanUkrainianUruguayanUteVenezuelanVietnameseWelshWest IndianYakamaYaquiYugoslavianYumanYup'ikZimbabwean
Immigration
NonimmigrantsImmigrantsAfghanistanAfricaAlbaniaArgentinaArmeniaAsiaAustraliaAustriaBahamasBangladeshBarbadosBelarusBelgiumBelizeBoliviaBosnia and HerzegovinaBrazilBulgariaBurma/MyanmarCabo VerdeCambodiaCameroonCanadaCaribbeanCentral AmericaChileChinaColombiaCongoCosta RicaCroatiaCubaCzechoslovakiaDenmarkDominicaDominican RepublicEastern AfricaEastern AsiaEastern EuropeEcuadorEgyptEl SalvadorEnglandEritreaEthiopiaEuropeFijiFranceGermanyGhanaGreeceGrenadaGuatemalaGuyanaHaitiHondurasHong KongHungaryIndiaIndonesiaIranIraqIrelandIsraelItalyJamaicaJapanJordanKazakhstanKenyaKoreaKuwaitLaosLatin AmericaLatviaLebanonLiberiaLithuaniaMalaysiaMexicoMicronesiaMiddle AfricaMoldovaMoroccoNepalNetherlandsNicaraguaNigeriaNorth AmericaNorth MacedoniaNorthern AfricaNorthern EuropeNorwayOceaniaPakistanPanamaPeruPhilippinesPolandPortugalRomaniaRussiaSaudi ArabiaScotlandSenegalSerbiaSierra LeoneSingaporeSomaliaSouth AfricaSouth AmericaSouth Central AsiaSouth Eastern AsiaSouthern EuropeSpainSri LankaSt. Vincent and the GrenadinesSudanSwedenSwitzerlandSyriaTaiwanThailandTrinidad and TobagoTurkeyUgandaUkraineUruguayUzbekistanVenezuelaVietnamWest IndiesWestern AfricaWestern AsiaWestern EuropeYemenZaireZimbabweAzores
10th Grade
Income
Poverty
Unemployment
Labor Participation
Family Structure
Vehicle Availability
Education Level
Disability

10th Grade Comparison

Guyanese

Immigrants from Kuwait

Tragic
Exceptional
91.4%
10TH GRADE
0.0/ 100
METRIC RATING
300th/ 347
METRIC RANK
94.4%
10TH GRADE
96.8/ 100
METRIC RATING
112th/ 347
METRIC RANK

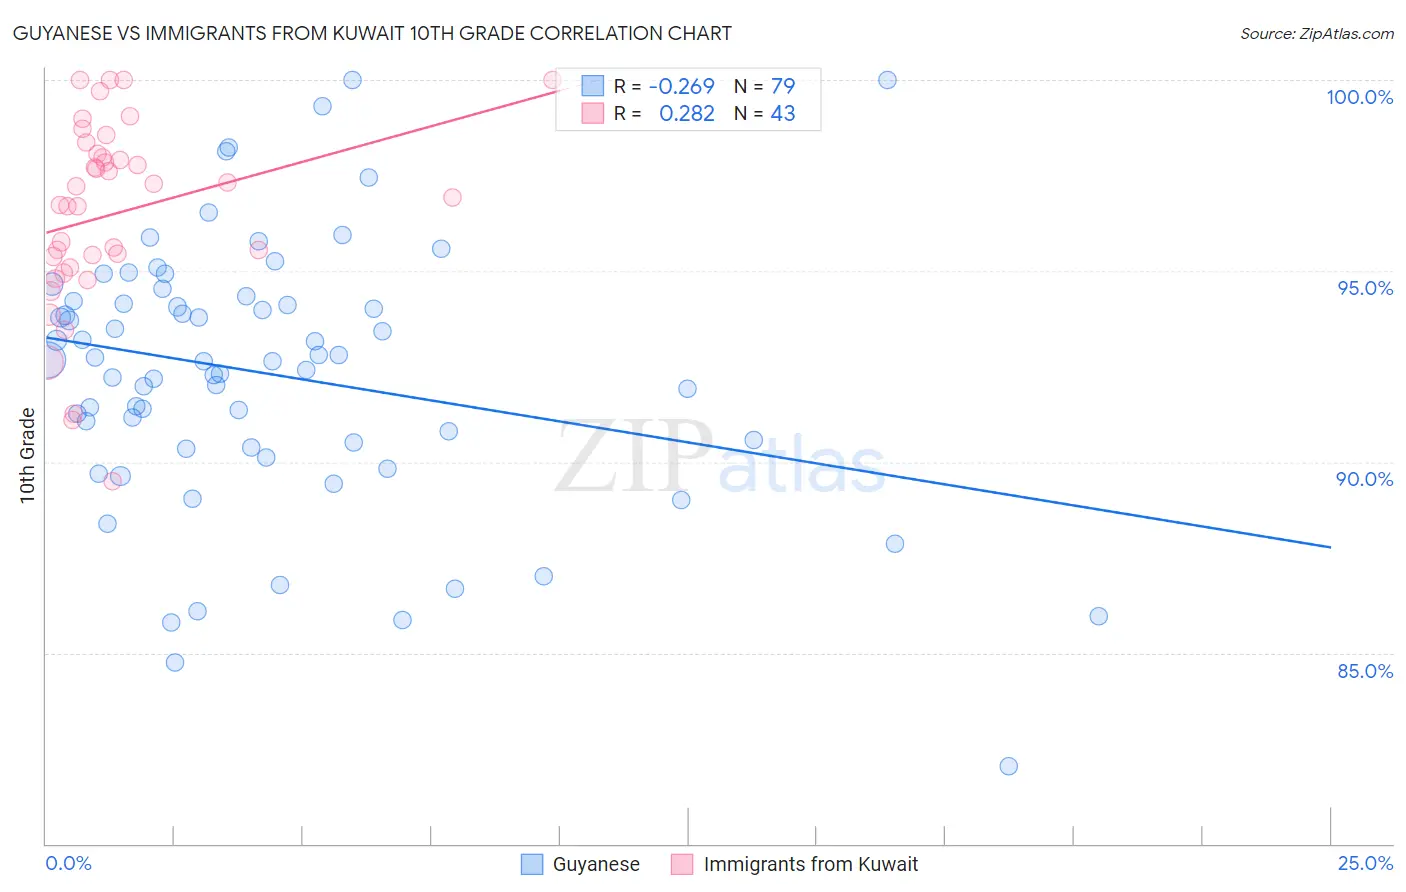
Guyanese vs Immigrants from Kuwait 10th Grade Correlation Chart

The statistical analysis conducted on geographies consisting of 176,937,226 people shows a weak negative correlation between the proportion of Guyanese and percentage of population with at least 10th grade education in the United States with a correlation coefficient (R) of -0.269 and weighted average of 91.4%. Similarly, the statistical analysis conducted on geographies consisting of 136,917,085 people shows a weak positive correlation between the proportion of Immigrants from Kuwait and percentage of population with at least 10th grade education in the United States with a correlation coefficient (R) of 0.282 and weighted average of 94.4%, a difference of 3.4%.
Guyanese vs Immigrants from Kuwait 10th Grade

10th Grade Correlation Summary

MeasurementGuyaneseImmigrants from Kuwait
Minimum82.0%89.5%
Maximum100.0%100.0%
Range18.0%10.5%
Mean92.3%96.5%
Median92.6%96.9%
Interquartile 25% (IQ1)90.4%95.1%
Interquartile 75% (IQ3)94.2%98.1%
Interquartile Range (IQR)3.8%3.0%
Standard Deviation (Sample)3.5%2.5%
Standard Deviation (Population)3.5%2.5%

Similar Demographics by 10th Grade

Demographics Similar to Guyanese by 10th Grade

In terms of 10th grade, the demographic groups most similar to Guyanese are Immigrants from Haiti (91.4%, a difference of 0.050%), Cuban (91.5%, a difference of 0.12%), Fijian (91.5%, a difference of 0.15%), Japanese (91.2%, a difference of 0.15%), and Immigrants from Guyana (91.2%, a difference of 0.16%).
DemographicsRating | Rank10th Grade
Indonesians
0.0
/100
|
#293
Tragic
91.8%
Haitians
0.0
/100
|
#294
Tragic
91.8%
Lumbee
0.0
/100
|
#295
Tragic
91.7%
Immigrants | Grenada
0.0
/100
|
#296
Tragic
91.6%
Fijians
0.0
/100
|
#297
Tragic
91.5%
Cubans
0.0
/100
|
#298
Tragic
91.5%
Immigrants | Haiti
0.0
/100
|
#299
Tragic
91.4%
Guyanese
0.0
/100
|
#300
Tragic
91.4%
Japanese
0.0
/100
|
#301
Tragic
91.2%
Immigrants | Guyana
0.0
/100
|
#302
Tragic
91.2%
Immigrants | Vietnam
0.0
/100
|
#303
Tragic
91.2%
Pima
0.0
/100
|
#304
Tragic
91.2%
Immigrants | Dominica
0.0
/100
|
#305
Tragic
91.1%
Yaqui
0.0
/100
|
#306
Tragic
91.1%
Immigrants | Fiji
0.0
/100
|
#307
Tragic
91.0%

Demographics Similar to Immigrants from Kuwait by 10th Grade

In terms of 10th grade, the demographic groups most similar to Immigrants from Kuwait are Immigrants from Zimbabwe (94.4%, a difference of 0.010%), Palestinian (94.4%, a difference of 0.020%), Burmese (94.5%, a difference of 0.030%), German Russian (94.4%, a difference of 0.030%), and Delaware (94.4%, a difference of 0.030%).
DemographicsRating | Rank10th Grade
Immigrants | Turkey
97.4
/100
|
#105
Exceptional
94.5%
Immigrants | Serbia
97.4
/100
|
#106
Exceptional
94.5%
Immigrants | Croatia
97.4
/100
|
#107
Exceptional
94.5%
Immigrants | North Macedonia
97.2
/100
|
#108
Exceptional
94.5%
Immigrants | Norway
97.2
/100
|
#109
Exceptional
94.5%
Burmese
97.1
/100
|
#110
Exceptional
94.5%
Immigrants | Zimbabwe
96.8
/100
|
#111
Exceptional
94.4%
Immigrants | Kuwait
96.8
/100
|
#112
Exceptional
94.4%
Palestinians
96.5
/100
|
#113
Exceptional
94.4%
German Russians
96.3
/100
|
#114
Exceptional
94.4%
Delaware
96.3
/100
|
#115
Exceptional
94.4%
Sioux
96.2
/100
|
#116
Exceptional
94.4%
Immigrants | Hungary
95.8
/100
|
#117
Exceptional
94.4%
Jordanians
95.6
/100
|
#118
Exceptional
94.4%
Immigrants | Israel
95.4
/100
|
#119
Exceptional
94.4%