Hmong vs Immigrants from Kuwait 10th Grade
COMPARE
Hmong
Immigrants from Kuwait
10th Grade
10th Grade Comparison
Hmong
Immigrants from Kuwait
94.1%
10TH GRADE
86.6/ 100
METRIC RATING
141st/ 347
METRIC RANK
94.4%
10TH GRADE
96.8/ 100
METRIC RATING
112th/ 347
METRIC RANK
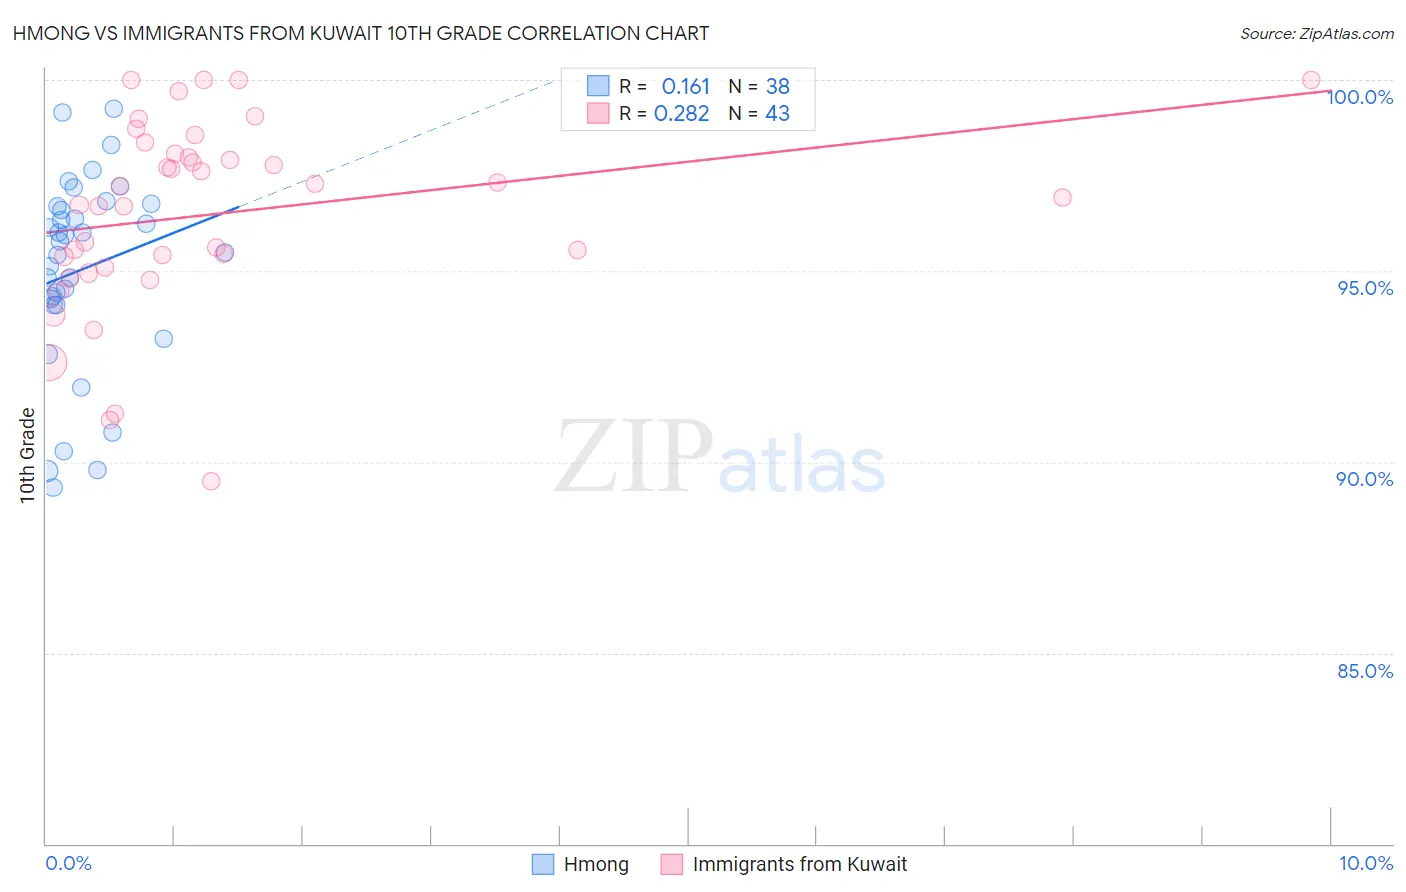
Hmong vs Immigrants from Kuwait 10th Grade Correlation Chart
The statistical analysis conducted on geographies consisting of 24,672,093 people shows a poor positive correlation between the proportion of Hmong and percentage of population with at least 10th grade education in the United States with a correlation coefficient (R) of 0.161 and weighted average of 94.1%. Similarly, the statistical analysis conducted on geographies consisting of 136,917,085 people shows a weak positive correlation between the proportion of Immigrants from Kuwait and percentage of population with at least 10th grade education in the United States with a correlation coefficient (R) of 0.282 and weighted average of 94.4%, a difference of 0.34%.
10th Grade Correlation Summary
| Measurement | Hmong | Immigrants from Kuwait |
| Minimum | 89.3% | 89.5% |
| Maximum | 99.2% | 100.0% |
| Range | 9.9% | 10.5% |
| Mean | 95.0% | 96.5% |
| Median | 95.6% | 96.9% |
| Interquartile 25% (IQ1) | 94.1% | 95.1% |
| Interquartile 75% (IQ3) | 96.7% | 98.1% |
| Interquartile Range (IQR) | 2.6% | 3.0% |
| Standard Deviation (Sample) | 2.5% | 2.5% |
| Standard Deviation (Population) | 2.5% | 2.5% |
Similar Demographics by 10th Grade
Demographics Similar to Hmong by 10th Grade
In terms of 10th grade, the demographic groups most similar to Hmong are Albanian (94.1%, a difference of 0.0%), Immigrants from Jordan (94.1%, a difference of 0.020%), Cherokee (94.1%, a difference of 0.030%), Immigrants from Kazakhstan (94.1%, a difference of 0.030%), and Nonimmigrants (94.1%, a difference of 0.050%).
| Demographics | Rating | Rank | 10th Grade |
| Osage | 91.7 /100 | #134 | Exceptional 94.2% |
| Immigrants | Korea | 91.3 /100 | #135 | Exceptional 94.2% |
| Shoshone | 90.8 /100 | #136 | Exceptional 94.2% |
| Arapaho | 90.5 /100 | #137 | Exceptional 94.2% |
| Immigrants | Sri Lanka | 89.9 /100 | #138 | Excellent 94.2% |
| Immigrants | Bosnia and Herzegovina | 89.4 /100 | #139 | Excellent 94.2% |
| Immigrants | Jordan | 87.6 /100 | #140 | Excellent 94.1% |
| Hmong | 86.6 /100 | #141 | Excellent 94.1% |
| Albanians | 86.5 /100 | #142 | Excellent 94.1% |
| Cherokee | 84.9 /100 | #143 | Excellent 94.1% |
| Immigrants | Kazakhstan | 84.9 /100 | #144 | Excellent 94.1% |
| Immigrants | Nonimmigrants | 83.8 /100 | #145 | Excellent 94.1% |
| Chickasaw | 82.6 /100 | #146 | Excellent 94.1% |
| Immigrants | Ukraine | 81.5 /100 | #147 | Excellent 94.0% |
| Arabs | 80.9 /100 | #148 | Excellent 94.0% |
Demographics Similar to Immigrants from Kuwait by 10th Grade
In terms of 10th grade, the demographic groups most similar to Immigrants from Kuwait are Immigrants from Zimbabwe (94.4%, a difference of 0.010%), Palestinian (94.4%, a difference of 0.020%), Burmese (94.5%, a difference of 0.030%), German Russian (94.4%, a difference of 0.030%), and Delaware (94.4%, a difference of 0.030%).
| Demographics | Rating | Rank | 10th Grade |
| Immigrants | Turkey | 97.4 /100 | #105 | Exceptional 94.5% |
| Immigrants | Serbia | 97.4 /100 | #106 | Exceptional 94.5% |
| Immigrants | Croatia | 97.4 /100 | #107 | Exceptional 94.5% |
| Immigrants | North Macedonia | 97.2 /100 | #108 | Exceptional 94.5% |
| Immigrants | Norway | 97.2 /100 | #109 | Exceptional 94.5% |
| Burmese | 97.1 /100 | #110 | Exceptional 94.5% |
| Immigrants | Zimbabwe | 96.8 /100 | #111 | Exceptional 94.4% |
| Immigrants | Kuwait | 96.8 /100 | #112 | Exceptional 94.4% |
| Palestinians | 96.5 /100 | #113 | Exceptional 94.4% |
| German Russians | 96.3 /100 | #114 | Exceptional 94.4% |
| Delaware | 96.3 /100 | #115 | Exceptional 94.4% |
| Sioux | 96.2 /100 | #116 | Exceptional 94.4% |
| Immigrants | Hungary | 95.8 /100 | #117 | Exceptional 94.4% |
| Jordanians | 95.6 /100 | #118 | Exceptional 94.4% |
| Immigrants | Israel | 95.4 /100 | #119 | Exceptional 94.4% |