Scandinavian vs Immigrants from Ghana 10th Grade
COMPARE
Scandinavian
Immigrants from Ghana
10th Grade
10th Grade Comparison
Scandinavians
Immigrants from Ghana
95.6%
10TH GRADE
100.0/ 100
METRIC RATING
19th/ 347
METRIC RANK
92.5%
10TH GRADE
0.3/ 100
METRIC RATING
268th/ 347
METRIC RANK
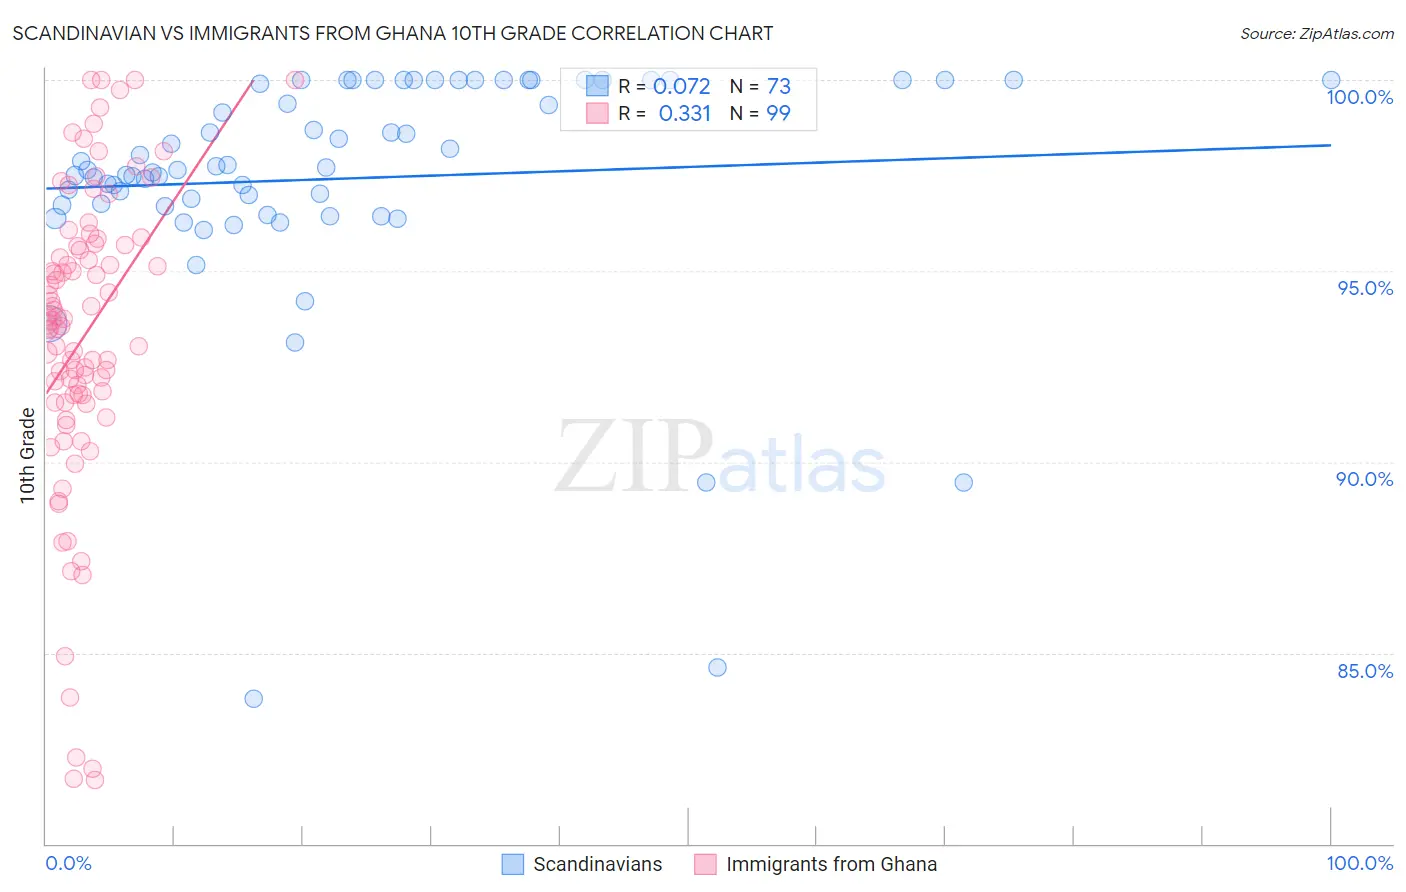
Scandinavian vs Immigrants from Ghana 10th Grade Correlation Chart
The statistical analysis conducted on geographies consisting of 472,660,435 people shows a slight positive correlation between the proportion of Scandinavians and percentage of population with at least 10th grade education in the United States with a correlation coefficient (R) of 0.072 and weighted average of 95.6%. Similarly, the statistical analysis conducted on geographies consisting of 199,952,023 people shows a mild positive correlation between the proportion of Immigrants from Ghana and percentage of population with at least 10th grade education in the United States with a correlation coefficient (R) of 0.331 and weighted average of 92.5%, a difference of 3.3%.
10th Grade Correlation Summary
| Measurement | Scandinavian | Immigrants from Ghana |
| Minimum | 83.8% | 81.7% |
| Maximum | 100.0% | 100.0% |
| Range | 16.2% | 18.3% |
| Mean | 97.4% | 93.2% |
| Median | 97.6% | 93.6% |
| Interquartile 25% (IQ1) | 96.7% | 91.6% |
| Interquartile 75% (IQ3) | 100.0% | 95.7% |
| Interquartile Range (IQR) | 3.3% | 4.1% |
| Standard Deviation (Sample) | 3.1% | 4.0% |
| Standard Deviation (Population) | 3.1% | 4.0% |
Similar Demographics by 10th Grade
Demographics Similar to Scandinavians by 10th Grade
In terms of 10th grade, the demographic groups most similar to Scandinavians are Italian (95.6%, a difference of 0.0%), Latvian (95.6%, a difference of 0.010%), Scottish (95.6%, a difference of 0.020%), Chinese (95.5%, a difference of 0.020%), and Dutch (95.5%, a difference of 0.030%).
| Demographics | Rating | Rank | 10th Grade |
| Tlingit-Haida | 100.0 /100 | #12 | Exceptional 95.7% |
| English | 100.0 /100 | #13 | Exceptional 95.6% |
| Tsimshian | 100.0 /100 | #14 | Exceptional 95.6% |
| Irish | 100.0 /100 | #15 | Exceptional 95.6% |
| Scottish | 100.0 /100 | #16 | Exceptional 95.6% |
| Latvians | 100.0 /100 | #17 | Exceptional 95.6% |
| Italians | 100.0 /100 | #18 | Exceptional 95.6% |
| Scandinavians | 100.0 /100 | #19 | Exceptional 95.6% |
| Chinese | 100.0 /100 | #20 | Exceptional 95.5% |
| Dutch | 100.0 /100 | #21 | Exceptional 95.5% |
| Eastern Europeans | 100.0 /100 | #22 | Exceptional 95.5% |
| Czechs | 100.0 /100 | #23 | Exceptional 95.5% |
| Europeans | 100.0 /100 | #24 | Exceptional 95.5% |
| Maltese | 100.0 /100 | #25 | Exceptional 95.5% |
| Welsh | 100.0 /100 | #26 | Exceptional 95.5% |
Demographics Similar to Immigrants from Ghana by 10th Grade
In terms of 10th grade, the demographic groups most similar to Immigrants from Ghana are Taiwanese (92.5%, a difference of 0.0%), Dutch West Indian (92.6%, a difference of 0.010%), Immigrants from Philippines (92.6%, a difference of 0.010%), Immigrants from Colombia (92.5%, a difference of 0.020%), and Immigrants from Uruguay (92.5%, a difference of 0.020%).
| Demographics | Rating | Rank | 10th Grade |
| Paiute | 0.4 /100 | #261 | Tragic 92.6% |
| Immigrants | South America | 0.4 /100 | #262 | Tragic 92.6% |
| Apache | 0.4 /100 | #263 | Tragic 92.6% |
| Peruvians | 0.4 /100 | #264 | Tragic 92.6% |
| Dutch West Indians | 0.4 /100 | #265 | Tragic 92.6% |
| Immigrants | Philippines | 0.4 /100 | #266 | Tragic 92.6% |
| Taiwanese | 0.3 /100 | #267 | Tragic 92.5% |
| Immigrants | Ghana | 0.3 /100 | #268 | Tragic 92.5% |
| Immigrants | Colombia | 0.3 /100 | #269 | Tragic 92.5% |
| Immigrants | Uruguay | 0.3 /100 | #270 | Tragic 92.5% |
| Immigrants | Eritrea | 0.3 /100 | #271 | Tragic 92.5% |
| Immigrants | Western Africa | 0.3 /100 | #272 | Tragic 92.5% |
| Trinidadians and Tobagonians | 0.2 /100 | #273 | Tragic 92.4% |
| Immigrants | Congo | 0.2 /100 | #274 | Tragic 92.4% |
| West Indians | 0.2 /100 | #275 | Tragic 92.4% |