Scandinavian vs Japanese 10th Grade
COMPARE
Scandinavian
Japanese
10th Grade
10th Grade Comparison
Scandinavians
Japanese
95.6%
10TH GRADE
100.0/ 100
METRIC RATING
19th/ 347
METRIC RANK
91.2%
10TH GRADE
0.0/ 100
METRIC RATING
301st/ 347
METRIC RANK
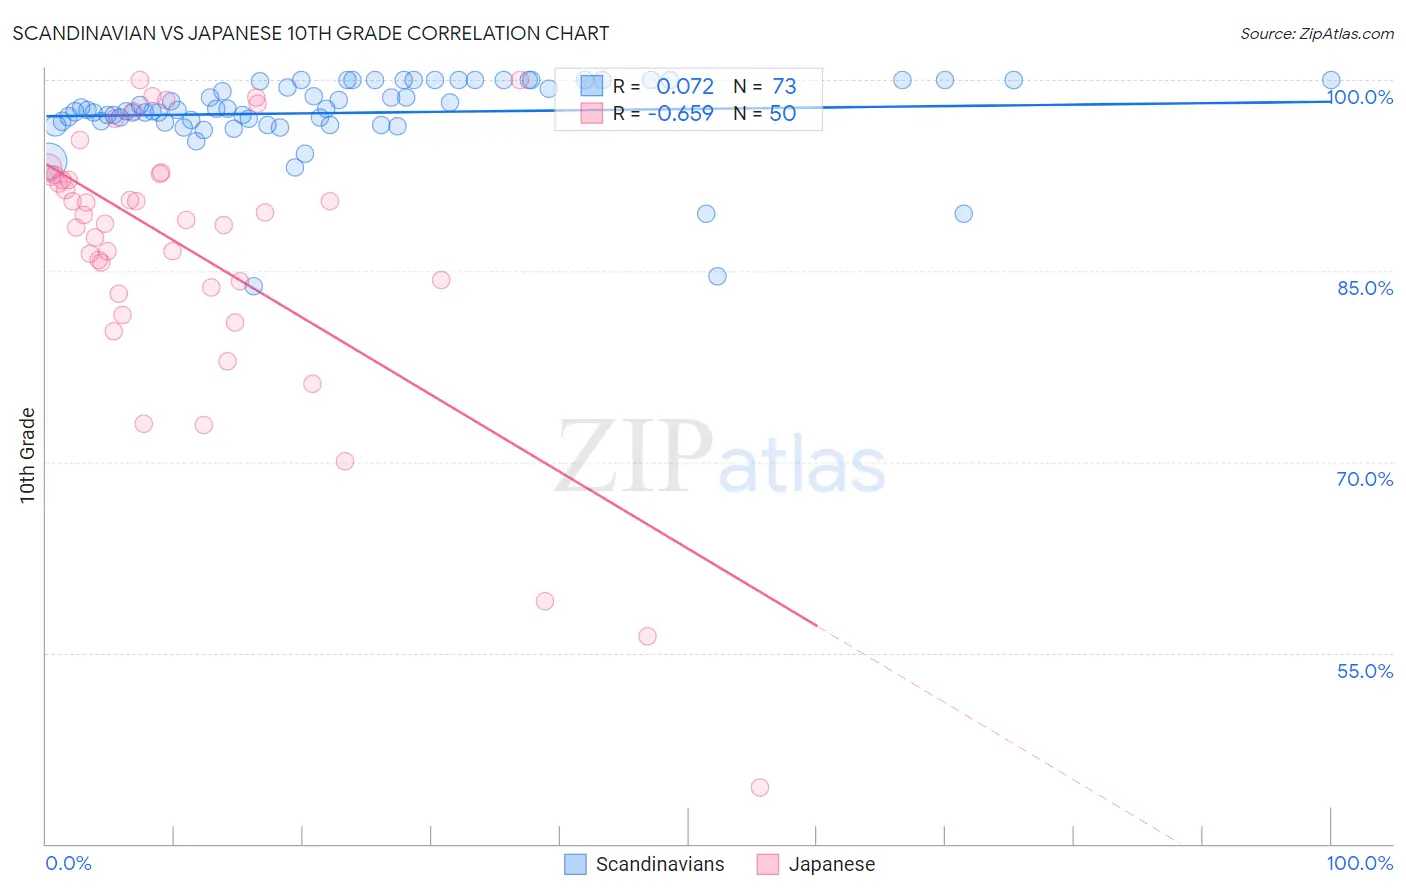
Scandinavian vs Japanese 10th Grade Correlation Chart
The statistical analysis conducted on geographies consisting of 472,660,435 people shows a slight positive correlation between the proportion of Scandinavians and percentage of population with at least 10th grade education in the United States with a correlation coefficient (R) of 0.072 and weighted average of 95.6%. Similarly, the statistical analysis conducted on geographies consisting of 249,183,224 people shows a significant negative correlation between the proportion of Japanese and percentage of population with at least 10th grade education in the United States with a correlation coefficient (R) of -0.659 and weighted average of 91.2%, a difference of 4.8%.
10th Grade Correlation Summary
| Measurement | Scandinavian | Japanese |
| Minimum | 83.8% | 44.4% |
| Maximum | 100.0% | 100.0% |
| Range | 16.2% | 55.6% |
| Mean | 97.4% | 86.5% |
| Median | 97.6% | 89.2% |
| Interquartile 25% (IQ1) | 96.7% | 83.7% |
| Interquartile 75% (IQ3) | 100.0% | 92.6% |
| Interquartile Range (IQR) | 3.3% | 8.9% |
| Standard Deviation (Sample) | 3.1% | 11.1% |
| Standard Deviation (Population) | 3.1% | 11.0% |
Similar Demographics by 10th Grade
Demographics Similar to Scandinavians by 10th Grade
In terms of 10th grade, the demographic groups most similar to Scandinavians are Italian (95.6%, a difference of 0.0%), Latvian (95.6%, a difference of 0.010%), Scottish (95.6%, a difference of 0.020%), Chinese (95.5%, a difference of 0.020%), and Dutch (95.5%, a difference of 0.030%).
| Demographics | Rating | Rank | 10th Grade |
| Tlingit-Haida | 100.0 /100 | #12 | Exceptional 95.7% |
| English | 100.0 /100 | #13 | Exceptional 95.6% |
| Tsimshian | 100.0 /100 | #14 | Exceptional 95.6% |
| Irish | 100.0 /100 | #15 | Exceptional 95.6% |
| Scottish | 100.0 /100 | #16 | Exceptional 95.6% |
| Latvians | 100.0 /100 | #17 | Exceptional 95.6% |
| Italians | 100.0 /100 | #18 | Exceptional 95.6% |
| Scandinavians | 100.0 /100 | #19 | Exceptional 95.6% |
| Chinese | 100.0 /100 | #20 | Exceptional 95.5% |
| Dutch | 100.0 /100 | #21 | Exceptional 95.5% |
| Eastern Europeans | 100.0 /100 | #22 | Exceptional 95.5% |
| Czechs | 100.0 /100 | #23 | Exceptional 95.5% |
| Europeans | 100.0 /100 | #24 | Exceptional 95.5% |
| Maltese | 100.0 /100 | #25 | Exceptional 95.5% |
| Welsh | 100.0 /100 | #26 | Exceptional 95.5% |
Demographics Similar to Japanese by 10th Grade
In terms of 10th grade, the demographic groups most similar to Japanese are Immigrants from Guyana (91.2%, a difference of 0.010%), Immigrants from Vietnam (91.2%, a difference of 0.030%), Pima (91.2%, a difference of 0.080%), Immigrants from Dominica (91.1%, a difference of 0.10%), and Guyanese (91.4%, a difference of 0.15%).
| Demographics | Rating | Rank | 10th Grade |
| Haitians | 0.0 /100 | #294 | Tragic 91.8% |
| Lumbee | 0.0 /100 | #295 | Tragic 91.7% |
| Immigrants | Grenada | 0.0 /100 | #296 | Tragic 91.6% |
| Fijians | 0.0 /100 | #297 | Tragic 91.5% |
| Cubans | 0.0 /100 | #298 | Tragic 91.5% |
| Immigrants | Haiti | 0.0 /100 | #299 | Tragic 91.4% |
| Guyanese | 0.0 /100 | #300 | Tragic 91.4% |
| Japanese | 0.0 /100 | #301 | Tragic 91.2% |
| Immigrants | Guyana | 0.0 /100 | #302 | Tragic 91.2% |
| Immigrants | Vietnam | 0.0 /100 | #303 | Tragic 91.2% |
| Pima | 0.0 /100 | #304 | Tragic 91.2% |
| Immigrants | Dominica | 0.0 /100 | #305 | Tragic 91.1% |
| Yaqui | 0.0 /100 | #306 | Tragic 91.1% |
| Immigrants | Fiji | 0.0 /100 | #307 | Tragic 91.0% |
| Immigrants | Bangladesh | 0.0 /100 | #308 | Tragic 91.0% |