Scandinavian vs Immigrants from China 10th Grade
COMPARE
Scandinavian
Immigrants from China
10th Grade
10th Grade Comparison
Scandinavians
Immigrants from China
95.6%
10TH GRADE
100.0/ 100
METRIC RATING
19th/ 347
METRIC RANK
93.2%
10TH GRADE
5.9/ 100
METRIC RATING
228th/ 347
METRIC RANK
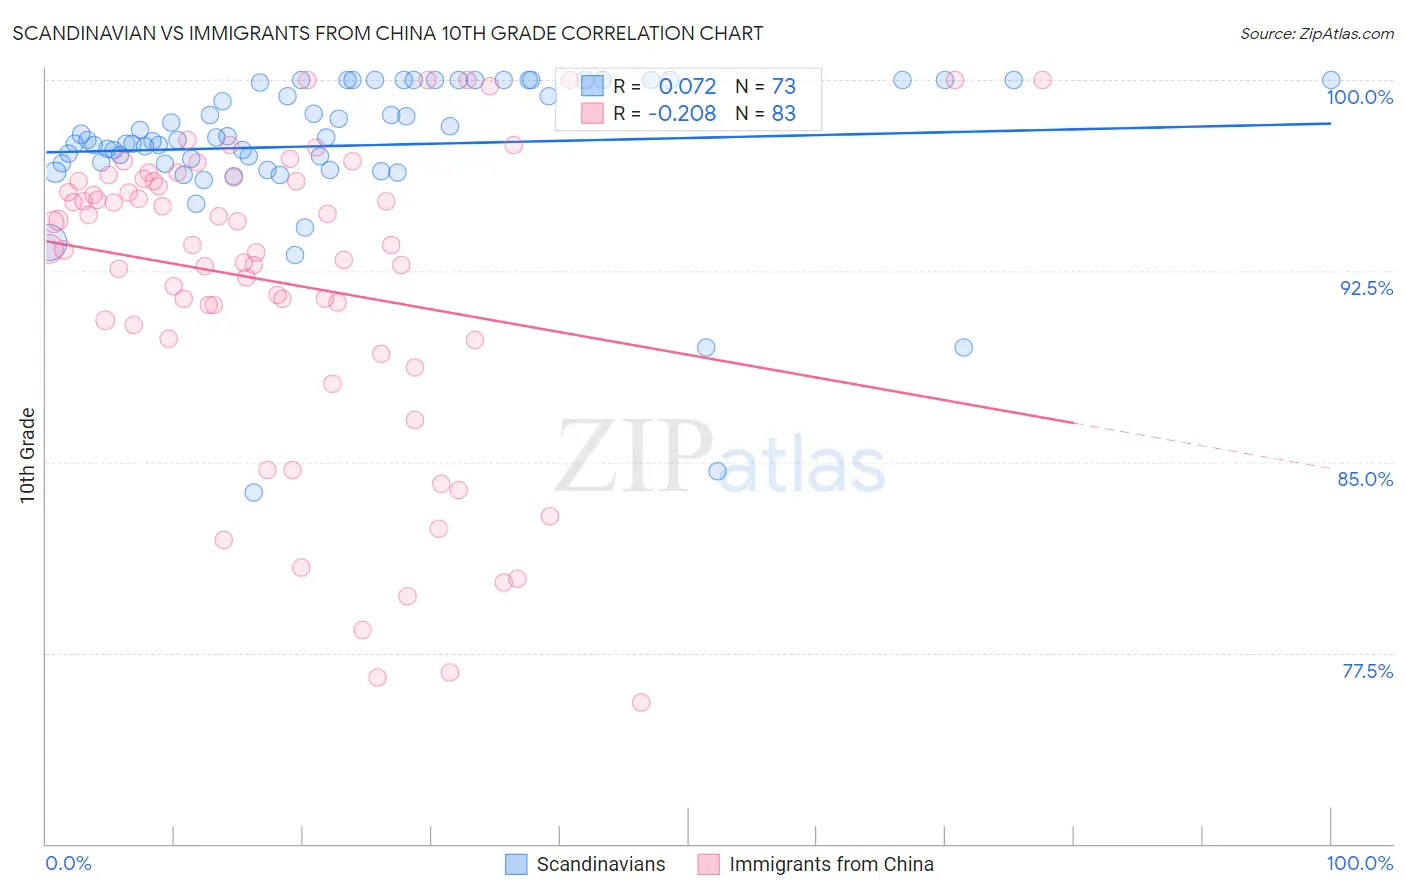
Scandinavian vs Immigrants from China 10th Grade Correlation Chart
The statistical analysis conducted on geographies consisting of 472,660,435 people shows a slight positive correlation between the proportion of Scandinavians and percentage of population with at least 10th grade education in the United States with a correlation coefficient (R) of 0.072 and weighted average of 95.6%. Similarly, the statistical analysis conducted on geographies consisting of 457,082,957 people shows a weak negative correlation between the proportion of Immigrants from China and percentage of population with at least 10th grade education in the United States with a correlation coefficient (R) of -0.208 and weighted average of 93.2%, a difference of 2.6%.
10th Grade Correlation Summary
| Measurement | Scandinavian | Immigrants from China |
| Minimum | 83.8% | 75.5% |
| Maximum | 100.0% | 100.0% |
| Range | 16.2% | 24.5% |
| Mean | 97.4% | 92.0% |
| Median | 97.6% | 93.5% |
| Interquartile 25% (IQ1) | 96.7% | 89.9% |
| Interquartile 75% (IQ3) | 100.0% | 96.0% |
| Interquartile Range (IQR) | 3.3% | 6.2% |
| Standard Deviation (Sample) | 3.1% | 6.1% |
| Standard Deviation (Population) | 3.1% | 6.1% |
Similar Demographics by 10th Grade
Demographics Similar to Scandinavians by 10th Grade
In terms of 10th grade, the demographic groups most similar to Scandinavians are Italian (95.6%, a difference of 0.0%), Latvian (95.6%, a difference of 0.010%), Scottish (95.6%, a difference of 0.020%), Chinese (95.5%, a difference of 0.020%), and Dutch (95.5%, a difference of 0.030%).
| Demographics | Rating | Rank | 10th Grade |
| Tlingit-Haida | 100.0 /100 | #12 | Exceptional 95.7% |
| English | 100.0 /100 | #13 | Exceptional 95.6% |
| Tsimshian | 100.0 /100 | #14 | Exceptional 95.6% |
| Irish | 100.0 /100 | #15 | Exceptional 95.6% |
| Scottish | 100.0 /100 | #16 | Exceptional 95.6% |
| Latvians | 100.0 /100 | #17 | Exceptional 95.6% |
| Italians | 100.0 /100 | #18 | Exceptional 95.6% |
| Scandinavians | 100.0 /100 | #19 | Exceptional 95.6% |
| Chinese | 100.0 /100 | #20 | Exceptional 95.5% |
| Dutch | 100.0 /100 | #21 | Exceptional 95.5% |
| Eastern Europeans | 100.0 /100 | #22 | Exceptional 95.5% |
| Czechs | 100.0 /100 | #23 | Exceptional 95.5% |
| Europeans | 100.0 /100 | #24 | Exceptional 95.5% |
| Maltese | 100.0 /100 | #25 | Exceptional 95.5% |
| Welsh | 100.0 /100 | #26 | Exceptional 95.5% |
Demographics Similar to Immigrants from China by 10th Grade
In terms of 10th grade, the demographic groups most similar to Immigrants from China are Somali (93.2%, a difference of 0.010%), Korean (93.2%, a difference of 0.010%), Black/African American (93.2%, a difference of 0.010%), Bolivian (93.2%, a difference of 0.030%), and Immigrants from Ethiopia (93.1%, a difference of 0.030%).
| Demographics | Rating | Rank | 10th Grade |
| Immigrants | Southern Europe | 8.9 /100 | #221 | Tragic 93.2% |
| Ethiopians | 7.9 /100 | #222 | Tragic 93.2% |
| Immigrants | Sierra Leone | 7.6 /100 | #223 | Tragic 93.2% |
| Bolivians | 6.7 /100 | #224 | Tragic 93.2% |
| Somalis | 6.2 /100 | #225 | Tragic 93.2% |
| Koreans | 6.1 /100 | #226 | Tragic 93.2% |
| Blacks/African Americans | 6.0 /100 | #227 | Tragic 93.2% |
| Immigrants | China | 5.9 /100 | #228 | Tragic 93.2% |
| Immigrants | Ethiopia | 5.1 /100 | #229 | Tragic 93.1% |
| Immigrants | Africa | 5.0 /100 | #230 | Tragic 93.1% |
| South American Indians | 4.9 /100 | #231 | Tragic 93.1% |
| Bahamians | 4.9 /100 | #232 | Tragic 93.1% |
| Comanche | 4.9 /100 | #233 | Tragic 93.1% |
| Sub-Saharan Africans | 4.7 /100 | #234 | Tragic 93.1% |
| Africans | 4.6 /100 | #235 | Tragic 93.1% |