Tlingit-Haida vs Immigrants from Europe Bachelor's Degree
COMPARE
Tlingit-Haida
Immigrants from Europe
Bachelor's Degree
Bachelor's Degree Comparison
Tlingit-Haida
Immigrants from Europe
34.6%
BACHELOR'S DEGREE
2.8/ 100
METRIC RATING
237th/ 347
METRIC RANK
43.4%
BACHELOR'S DEGREE
99.8/ 100
METRIC RATING
63rd/ 347
METRIC RANK
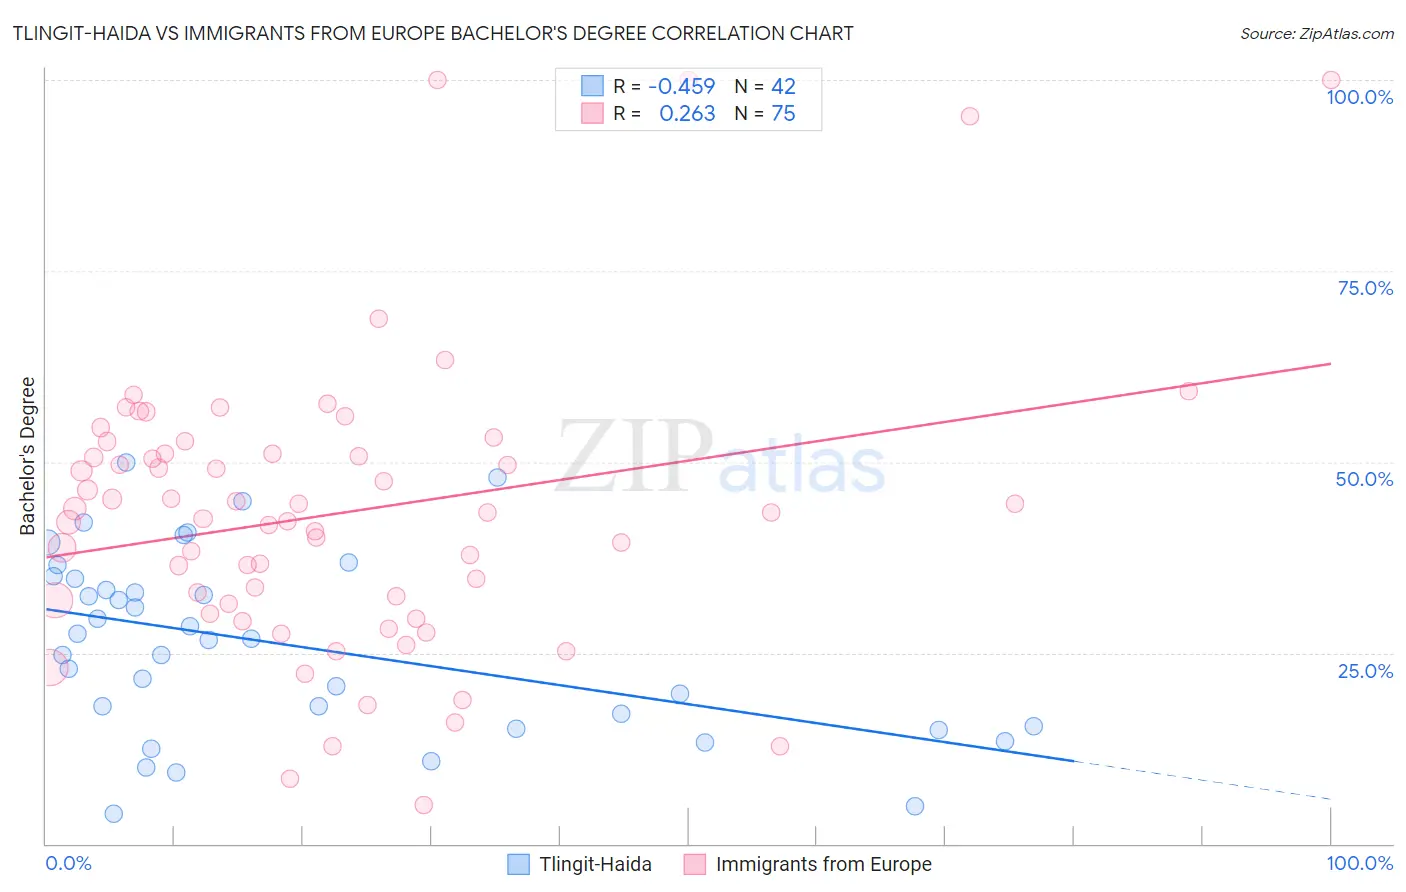
Tlingit-Haida vs Immigrants from Europe Bachelor's Degree Correlation Chart
The statistical analysis conducted on geographies consisting of 60,872,339 people shows a moderate negative correlation between the proportion of Tlingit-Haida and percentage of population with at least bachelor's degree education in the United States with a correlation coefficient (R) of -0.459 and weighted average of 34.6%. Similarly, the statistical analysis conducted on geographies consisting of 547,335,067 people shows a weak positive correlation between the proportion of Immigrants from Europe and percentage of population with at least bachelor's degree education in the United States with a correlation coefficient (R) of 0.263 and weighted average of 43.4%, a difference of 25.6%.
Bachelor's Degree Correlation Summary
| Measurement | Tlingit-Haida | Immigrants from Europe |
| Minimum | 4.0% | 5.0% |
| Maximum | 50.0% | 100.0% |
| Range | 46.0% | 95.0% |
| Mean | 26.0% | 43.3% |
| Median | 26.8% | 43.3% |
| Interquartile 25% (IQ1) | 15.4% | 31.4% |
| Interquartile 75% (IQ3) | 34.8% | 51.1% |
| Interquartile Range (IQR) | 19.4% | 19.6% |
| Standard Deviation (Sample) | 11.9% | 18.9% |
| Standard Deviation (Population) | 11.7% | 18.8% |
Similar Demographics by Bachelor's Degree
Demographics Similar to Tlingit-Haida by Bachelor's Degree
In terms of bachelor's degree, the demographic groups most similar to Tlingit-Haida are Liberian (34.6%, a difference of 0.040%), Immigrants from West Indies (34.6%, a difference of 0.14%), Guamanian/Chamorro (34.6%, a difference of 0.24%), Guyanese (34.5%, a difference of 0.28%), and British West Indian (34.5%, a difference of 0.30%).
| Demographics | Rating | Rank | Bachelor's Degree |
| Immigrants | Grenada | 4.3 /100 | #230 | Tragic 35.0% |
| Immigrants | St. Vincent and the Grenadines | 4.3 /100 | #231 | Tragic 35.0% |
| Hmong | 3.4 /100 | #232 | Tragic 34.8% |
| Immigrants | Ecuador | 3.3 /100 | #233 | Tragic 34.7% |
| Guamanians/Chamorros | 3.0 /100 | #234 | Tragic 34.6% |
| Immigrants | West Indies | 2.9 /100 | #235 | Tragic 34.6% |
| Liberians | 2.8 /100 | #236 | Tragic 34.6% |
| Tlingit-Haida | 2.8 /100 | #237 | Tragic 34.6% |
| Guyanese | 2.5 /100 | #238 | Tragic 34.5% |
| British West Indians | 2.5 /100 | #239 | Tragic 34.5% |
| Tongans | 2.0 /100 | #240 | Tragic 34.3% |
| Immigrants | Cambodia | 1.9 /100 | #241 | Tragic 34.2% |
| Immigrants | Nonimmigrants | 1.8 /100 | #242 | Tragic 34.2% |
| Immigrants | Guyana | 1.4 /100 | #243 | Tragic 33.9% |
| Delaware | 1.2 /100 | #244 | Tragic 33.8% |
Demographics Similar to Immigrants from Europe by Bachelor's Degree
In terms of bachelor's degree, the demographic groups most similar to Immigrants from Europe are Immigrants from Kazakhstan (43.4%, a difference of 0.050%), Argentinean (43.3%, a difference of 0.27%), Zimbabwean (43.3%, a difference of 0.28%), Immigrants from Netherlands (43.3%, a difference of 0.30%), and Egyptian (43.3%, a difference of 0.32%).
| Demographics | Rating | Rank | Bachelor's Degree |
| Immigrants | Serbia | 99.9 /100 | #56 | Exceptional 44.1% |
| Paraguayans | 99.9 /100 | #57 | Exceptional 44.0% |
| Immigrants | Czechoslovakia | 99.9 /100 | #58 | Exceptional 44.0% |
| Australians | 99.9 /100 | #59 | Exceptional 44.0% |
| New Zealanders | 99.9 /100 | #60 | Exceptional 44.0% |
| South Africans | 99.8 /100 | #61 | Exceptional 43.6% |
| Immigrants | Kazakhstan | 99.8 /100 | #62 | Exceptional 43.4% |
| Immigrants | Europe | 99.8 /100 | #63 | Exceptional 43.4% |
| Argentineans | 99.7 /100 | #64 | Exceptional 43.3% |
| Zimbabweans | 99.7 /100 | #65 | Exceptional 43.3% |
| Immigrants | Netherlands | 99.7 /100 | #66 | Exceptional 43.3% |
| Egyptians | 99.7 /100 | #67 | Exceptional 43.3% |
| Immigrants | Indonesia | 99.7 /100 | #68 | Exceptional 43.3% |
| Immigrants | Pakistan | 99.7 /100 | #69 | Exceptional 43.1% |
| Immigrants | Romania | 99.6 /100 | #70 | Exceptional 42.9% |