Macedonian vs Immigrants from Europe Bachelor's Degree
COMPARE
Macedonian
Immigrants from Europe
Bachelor's Degree
Bachelor's Degree Comparison
Macedonians
Immigrants from Europe
41.4%
BACHELOR'S DEGREE
98.1/ 100
METRIC RATING
100th/ 347
METRIC RANK
43.4%
BACHELOR'S DEGREE
99.8/ 100
METRIC RATING
63rd/ 347
METRIC RANK
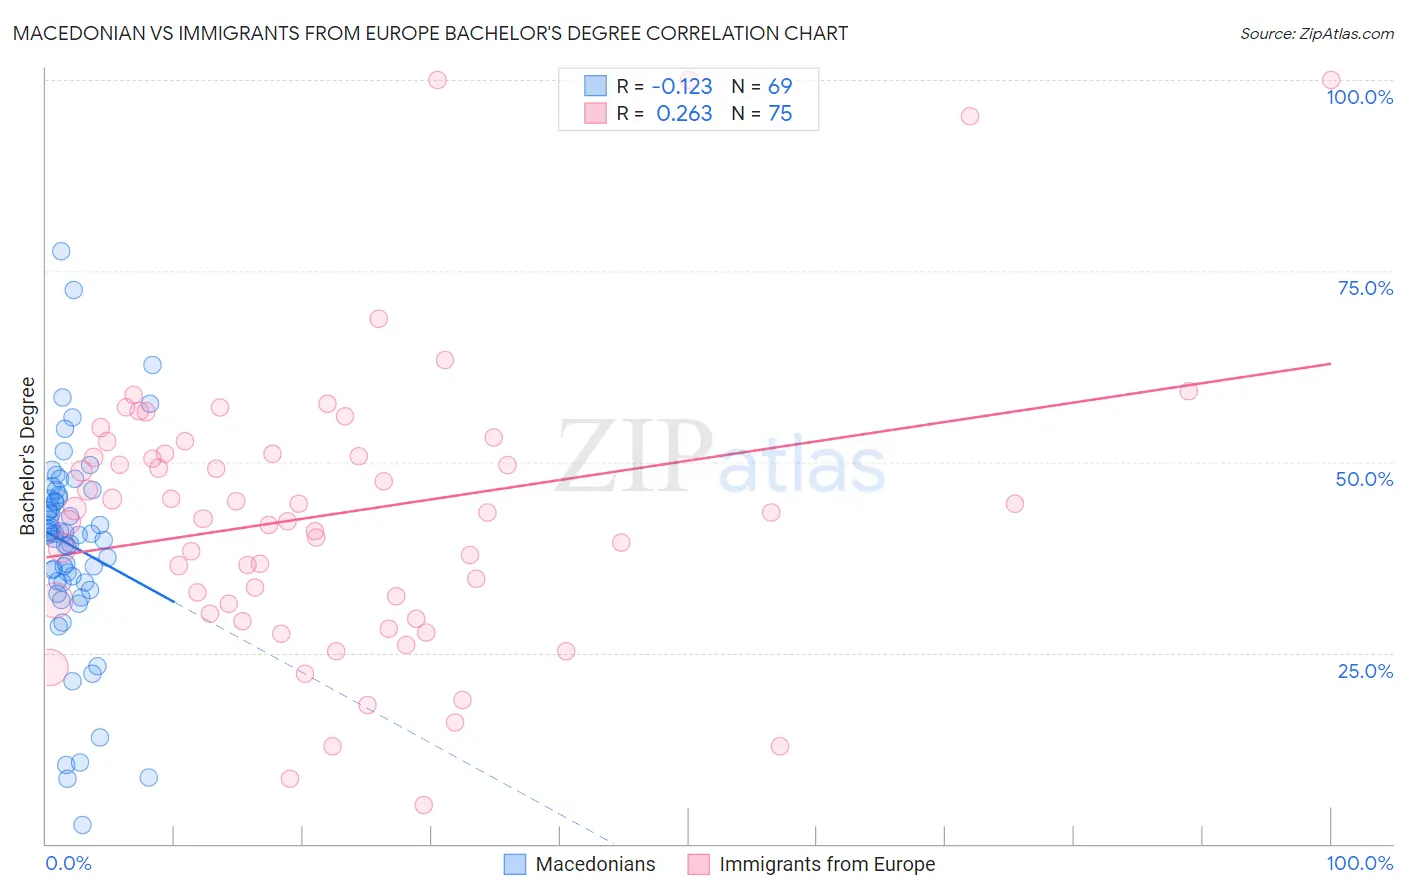
Macedonian vs Immigrants from Europe Bachelor's Degree Correlation Chart
The statistical analysis conducted on geographies consisting of 132,656,802 people shows a poor negative correlation between the proportion of Macedonians and percentage of population with at least bachelor's degree education in the United States with a correlation coefficient (R) of -0.123 and weighted average of 41.4%. Similarly, the statistical analysis conducted on geographies consisting of 547,335,067 people shows a weak positive correlation between the proportion of Immigrants from Europe and percentage of population with at least bachelor's degree education in the United States with a correlation coefficient (R) of 0.263 and weighted average of 43.4%, a difference of 4.7%.
Bachelor's Degree Correlation Summary
| Measurement | Macedonian | Immigrants from Europe |
| Minimum | 2.5% | 5.0% |
| Maximum | 77.6% | 100.0% |
| Range | 75.1% | 95.0% |
| Mean | 39.1% | 43.3% |
| Median | 40.7% | 43.3% |
| Interquartile 25% (IQ1) | 34.2% | 31.4% |
| Interquartile 75% (IQ3) | 45.5% | 51.1% |
| Interquartile Range (IQR) | 11.3% | 19.6% |
| Standard Deviation (Sample) | 13.5% | 18.9% |
| Standard Deviation (Population) | 13.4% | 18.8% |
Similar Demographics by Bachelor's Degree
Demographics Similar to Macedonians by Bachelor's Degree
In terms of bachelor's degree, the demographic groups most similar to Macedonians are Immigrants from England (41.4%, a difference of 0.030%), Immigrants from Morocco (41.4%, a difference of 0.030%), Immigrants from Ukraine (41.5%, a difference of 0.26%), Immigrants from Italy (41.3%, a difference of 0.29%), and Romanian (41.6%, a difference of 0.37%).
| Demographics | Rating | Rank | Bachelor's Degree |
| Immigrants | Canada | 98.6 /100 | #93 | Exceptional 41.7% |
| Immigrants | Nepal | 98.6 /100 | #94 | Exceptional 41.7% |
| Immigrants | North America | 98.5 /100 | #95 | Exceptional 41.7% |
| Immigrants | Moldova | 98.4 /100 | #96 | Exceptional 41.6% |
| Romanians | 98.4 /100 | #97 | Exceptional 41.6% |
| Immigrants | Ukraine | 98.3 /100 | #98 | Exceptional 41.5% |
| Immigrants | England | 98.1 /100 | #99 | Exceptional 41.4% |
| Macedonians | 98.1 /100 | #100 | Exceptional 41.4% |
| Immigrants | Morocco | 98.0 /100 | #101 | Exceptional 41.4% |
| Immigrants | Italy | 97.8 /100 | #102 | Exceptional 41.3% |
| Chileans | 97.5 /100 | #103 | Exceptional 41.2% |
| Jordanians | 97.4 /100 | #104 | Exceptional 41.2% |
| Syrians | 97.4 /100 | #105 | Exceptional 41.1% |
| Alsatians | 97.0 /100 | #106 | Exceptional 41.0% |
| Northern Europeans | 96.8 /100 | #107 | Exceptional 41.0% |
Demographics Similar to Immigrants from Europe by Bachelor's Degree
In terms of bachelor's degree, the demographic groups most similar to Immigrants from Europe are Immigrants from Kazakhstan (43.4%, a difference of 0.050%), Argentinean (43.3%, a difference of 0.27%), Zimbabwean (43.3%, a difference of 0.28%), Immigrants from Netherlands (43.3%, a difference of 0.30%), and Egyptian (43.3%, a difference of 0.32%).
| Demographics | Rating | Rank | Bachelor's Degree |
| Immigrants | Serbia | 99.9 /100 | #56 | Exceptional 44.1% |
| Paraguayans | 99.9 /100 | #57 | Exceptional 44.0% |
| Immigrants | Czechoslovakia | 99.9 /100 | #58 | Exceptional 44.0% |
| Australians | 99.9 /100 | #59 | Exceptional 44.0% |
| New Zealanders | 99.9 /100 | #60 | Exceptional 44.0% |
| South Africans | 99.8 /100 | #61 | Exceptional 43.6% |
| Immigrants | Kazakhstan | 99.8 /100 | #62 | Exceptional 43.4% |
| Immigrants | Europe | 99.8 /100 | #63 | Exceptional 43.4% |
| Argentineans | 99.7 /100 | #64 | Exceptional 43.3% |
| Zimbabweans | 99.7 /100 | #65 | Exceptional 43.3% |
| Immigrants | Netherlands | 99.7 /100 | #66 | Exceptional 43.3% |
| Egyptians | 99.7 /100 | #67 | Exceptional 43.3% |
| Immigrants | Indonesia | 99.7 /100 | #68 | Exceptional 43.3% |
| Immigrants | Pakistan | 99.7 /100 | #69 | Exceptional 43.1% |
| Immigrants | Romania | 99.6 /100 | #70 | Exceptional 42.9% |