Immigrants from Eastern Asia vs Black/African American Bachelor's Degree
COMPARE
Immigrants from Eastern Asia
Black/African American
Bachelor's Degree
Bachelor's Degree Comparison
Immigrants from Eastern Asia
Blacks/African Americans
48.1%
BACHELOR'S DEGREE
100.0/ 100
METRIC RATING
15th/ 347
METRIC RANK
30.9%
BACHELOR'S DEGREE
0.1/ 100
METRIC RATING
291st/ 347
METRIC RANK
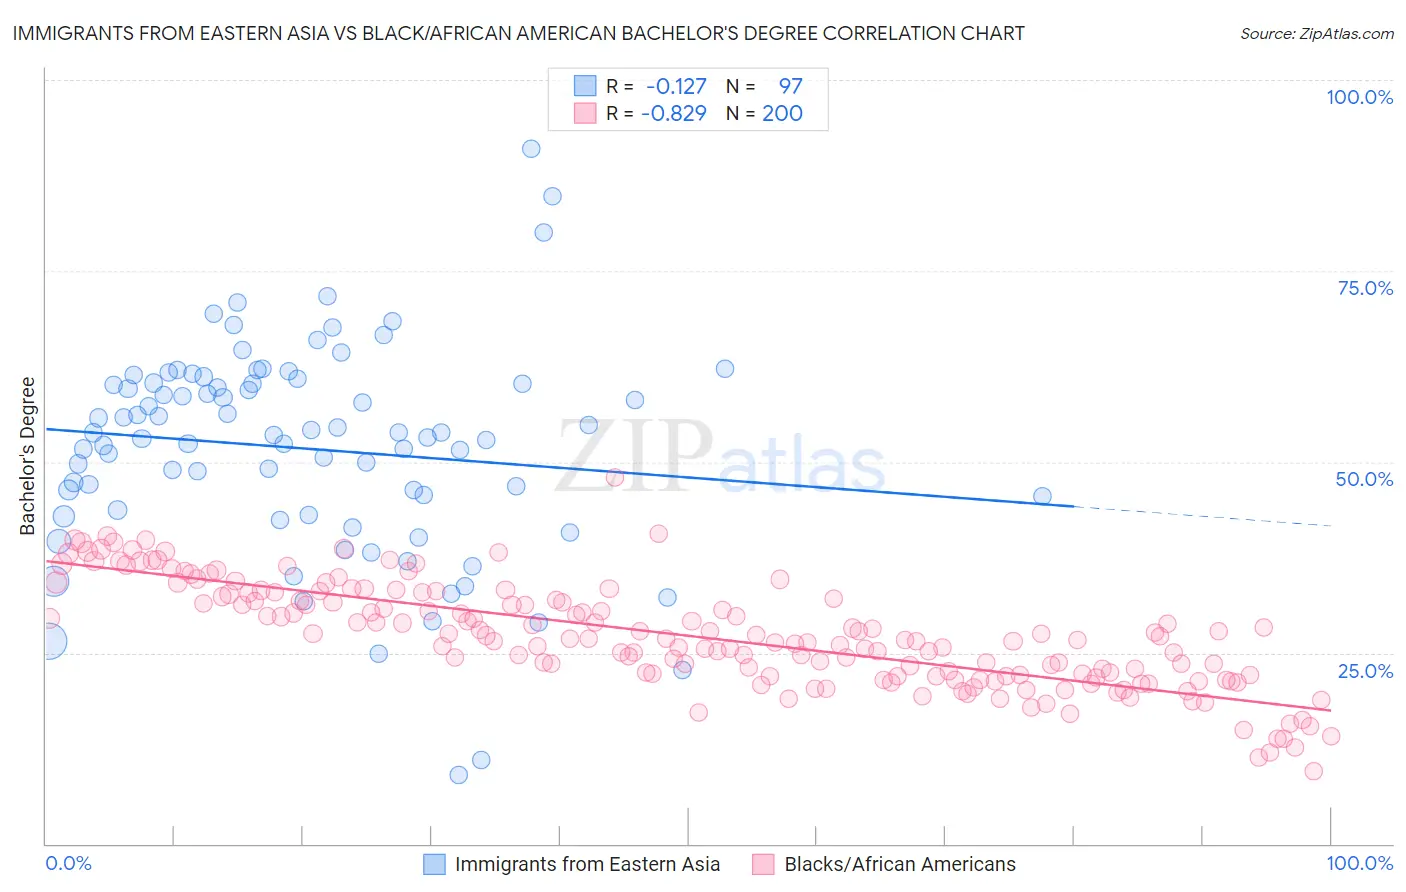
Immigrants from Eastern Asia vs Black/African American Bachelor's Degree Correlation Chart
The statistical analysis conducted on geographies consisting of 499,849,194 people shows a poor negative correlation between the proportion of Immigrants from Eastern Asia and percentage of population with at least bachelor's degree education in the United States with a correlation coefficient (R) of -0.127 and weighted average of 48.1%. Similarly, the statistical analysis conducted on geographies consisting of 565,857,967 people shows a very strong negative correlation between the proportion of Blacks/African Americans and percentage of population with at least bachelor's degree education in the United States with a correlation coefficient (R) of -0.829 and weighted average of 30.9%, a difference of 55.6%.
Bachelor's Degree Correlation Summary
| Measurement | Immigrants from Eastern Asia | Black/African American |
| Minimum | 9.0% | 9.5% |
| Maximum | 91.0% | 47.9% |
| Range | 81.9% | 38.4% |
| Mean | 51.7% | 27.2% |
| Median | 53.6% | 26.9% |
| Interquartile 25% (IQ1) | 43.4% | 22.0% |
| Interquartile 75% (IQ3) | 60.3% | 32.3% |
| Interquartile Range (IQR) | 16.9% | 10.3% |
| Standard Deviation (Sample) | 13.9% | 6.8% |
| Standard Deviation (Population) | 13.8% | 6.8% |
Similar Demographics by Bachelor's Degree
Demographics Similar to Immigrants from Eastern Asia by Bachelor's Degree
In terms of bachelor's degree, the demographic groups most similar to Immigrants from Eastern Asia are Immigrants from Hong Kong (48.2%, a difference of 0.14%), Immigrants from South Central Asia (48.3%, a difference of 0.42%), Soviet Union (47.9%, a difference of 0.46%), Immigrants from China (48.4%, a difference of 0.56%), and Immigrants from Australia (48.5%, a difference of 0.74%).
| Demographics | Rating | Rank | Bachelor's Degree |
| Thais | 100.0 /100 | #8 | Exceptional 50.1% |
| Immigrants | Israel | 100.0 /100 | #9 | Exceptional 50.0% |
| Cypriots | 100.0 /100 | #10 | Exceptional 49.0% |
| Immigrants | Australia | 100.0 /100 | #11 | Exceptional 48.5% |
| Immigrants | China | 100.0 /100 | #12 | Exceptional 48.4% |
| Immigrants | South Central Asia | 100.0 /100 | #13 | Exceptional 48.3% |
| Immigrants | Hong Kong | 100.0 /100 | #14 | Exceptional 48.2% |
| Immigrants | Eastern Asia | 100.0 /100 | #15 | Exceptional 48.1% |
| Soviet Union | 100.0 /100 | #16 | Exceptional 47.9% |
| Eastern Europeans | 100.0 /100 | #17 | Exceptional 47.5% |
| Indians (Asian) | 100.0 /100 | #18 | Exceptional 47.4% |
| Cambodians | 100.0 /100 | #19 | Exceptional 47.2% |
| Immigrants | Switzerland | 100.0 /100 | #20 | Exceptional 47.1% |
| Immigrants | Ireland | 100.0 /100 | #21 | Exceptional 47.1% |
| Immigrants | Belgium | 100.0 /100 | #22 | Exceptional 47.0% |
Demographics Similar to Blacks/African Americans by Bachelor's Degree
In terms of bachelor's degree, the demographic groups most similar to Blacks/African Americans are Immigrants from Honduras (30.9%, a difference of 0.040%), Puerto Rican (31.0%, a difference of 0.080%), Ute (30.9%, a difference of 0.080%), Cape Verdean (30.9%, a difference of 0.18%), and Guatemalan (31.0%, a difference of 0.22%).
| Demographics | Rating | Rank | Bachelor's Degree |
| Haitians | 0.1 /100 | #284 | Tragic 31.3% |
| Aleuts | 0.1 /100 | #285 | Tragic 31.3% |
| Immigrants | El Salvador | 0.1 /100 | #286 | Tragic 31.3% |
| Ottawa | 0.1 /100 | #287 | Tragic 31.1% |
| Guatemalans | 0.1 /100 | #288 | Tragic 31.0% |
| Puerto Ricans | 0.1 /100 | #289 | Tragic 31.0% |
| Immigrants | Honduras | 0.1 /100 | #290 | Tragic 30.9% |
| Blacks/African Americans | 0.1 /100 | #291 | Tragic 30.9% |
| Ute | 0.1 /100 | #292 | Tragic 30.9% |
| Cape Verdeans | 0.1 /100 | #293 | Tragic 30.9% |
| Immigrants | Guatemala | 0.0 /100 | #294 | Tragic 30.8% |
| Immigrants | Dominican Republic | 0.0 /100 | #295 | Tragic 30.7% |
| Puget Sound Salish | 0.0 /100 | #296 | Tragic 30.7% |
| Immigrants | Haiti | 0.0 /100 | #297 | Tragic 30.6% |
| Chippewa | 0.0 /100 | #298 | Tragic 30.6% |