Scandinavian vs Black/African American 1st Grade
COMPARE
Scandinavian
Black/African American
1st Grade
1st Grade Comparison
Scandinavians
Blacks/African Americans
98.5%
1ST GRADE
100.0/ 100
METRIC RATING
33rd/ 347
METRIC RANK
97.9%
1ST GRADE
30.7/ 100
METRIC RATING
191st/ 347
METRIC RANK
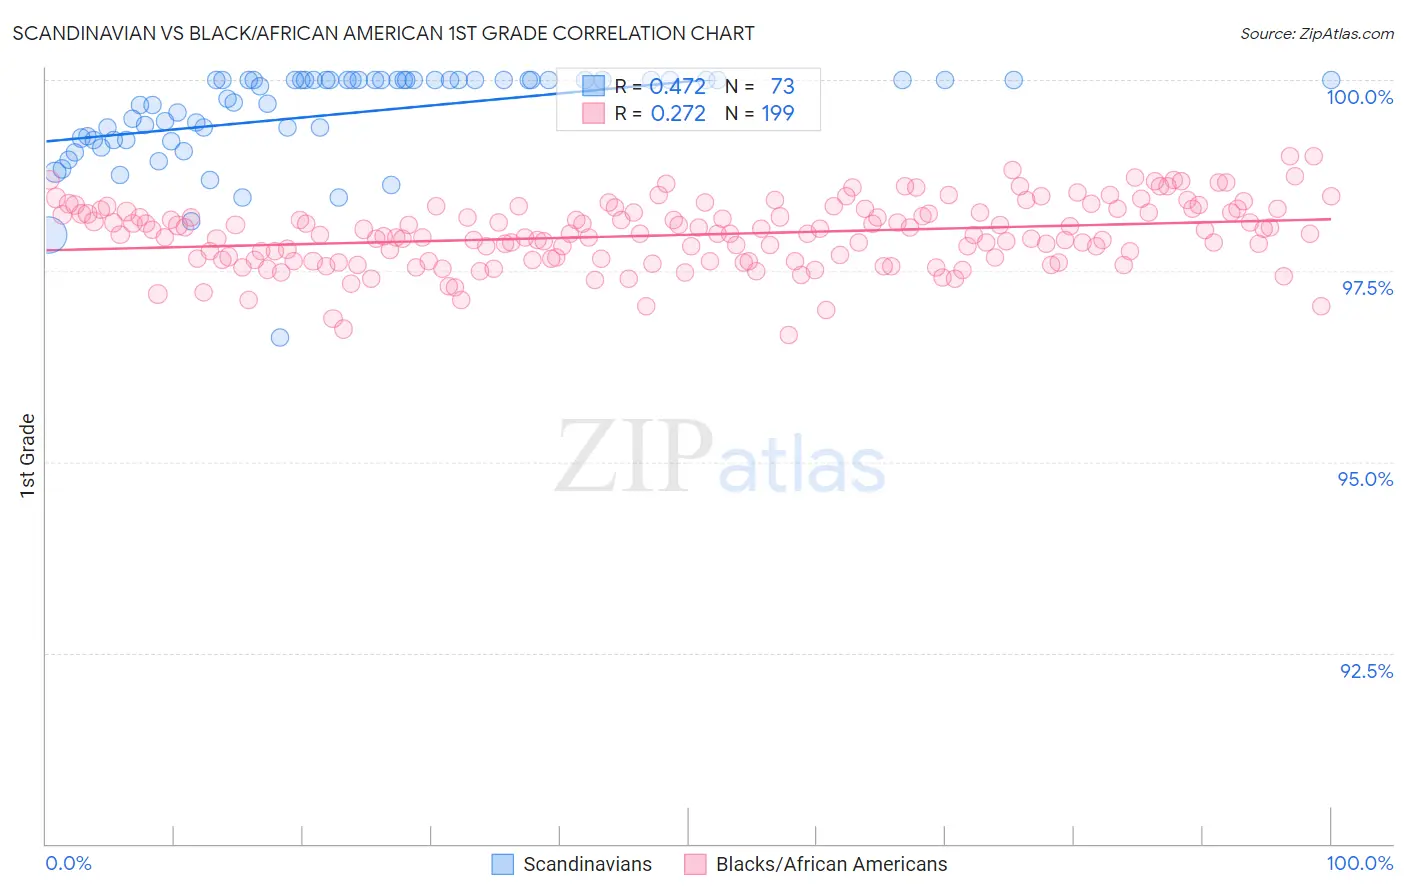
Scandinavian vs Black/African American 1st Grade Correlation Chart
The statistical analysis conducted on geographies consisting of 472,660,430 people shows a moderate positive correlation between the proportion of Scandinavians and percentage of population with at least 1st grade education in the United States with a correlation coefficient (R) of 0.472 and weighted average of 98.5%. Similarly, the statistical analysis conducted on geographies consisting of 566,043,750 people shows a weak positive correlation between the proportion of Blacks/African Americans and percentage of population with at least 1st grade education in the United States with a correlation coefficient (R) of 0.272 and weighted average of 97.9%, a difference of 0.69%.
1st Grade Correlation Summary
| Measurement | Scandinavian | Black/African American |
| Minimum | 96.6% | 96.7% |
| Maximum | 100.0% | 99.0% |
| Range | 3.4% | 2.3% |
| Mean | 99.5% | 98.0% |
| Median | 100.0% | 98.0% |
| Interquartile 25% (IQ1) | 99.2% | 97.6% |
| Interquartile 75% (IQ3) | 100.0% | 98.3% |
| Interquartile Range (IQR) | 0.79% | 0.62% |
| Standard Deviation (Sample) | 0.63% | 0.43% |
| Standard Deviation (Population) | 0.63% | 0.43% |
Similar Demographics by 1st Grade
Demographics Similar to Scandinavians by 1st Grade
In terms of 1st grade, the demographic groups most similar to Scandinavians are French Canadian (98.5%, a difference of 0.0%), French (98.6%, a difference of 0.010%), European (98.5%, a difference of 0.010%), Czech (98.5%, a difference of 0.010%), and Croatian (98.6%, a difference of 0.020%).
| Demographics | Rating | Rank | 1st Grade |
| Scotch-Irish | 100.0 /100 | #26 | Exceptional 98.6% |
| Poles | 100.0 /100 | #27 | Exceptional 98.6% |
| Croatians | 100.0 /100 | #28 | Exceptional 98.6% |
| French | 100.0 /100 | #29 | Exceptional 98.6% |
| Europeans | 100.0 /100 | #30 | Exceptional 98.5% |
| Czechs | 100.0 /100 | #31 | Exceptional 98.5% |
| French Canadians | 100.0 /100 | #32 | Exceptional 98.5% |
| Scandinavians | 100.0 /100 | #33 | Exceptional 98.5% |
| Swiss | 100.0 /100 | #34 | Exceptional 98.5% |
| Chinese | 100.0 /100 | #35 | Exceptional 98.5% |
| British | 100.0 /100 | #36 | Exceptional 98.5% |
| Italians | 99.9 /100 | #37 | Exceptional 98.5% |
| Chippewa | 99.9 /100 | #38 | Exceptional 98.5% |
| Latvians | 99.9 /100 | #39 | Exceptional 98.5% |
| Luxembourgers | 99.9 /100 | #40 | Exceptional 98.5% |
Demographics Similar to Blacks/African Americans by 1st Grade
In terms of 1st grade, the demographic groups most similar to Blacks/African Americans are Paraguayan (97.9%, a difference of 0.0%), Immigrants from Taiwan (97.9%, a difference of 0.0%), Panamanian (97.9%, a difference of 0.010%), Mongolian (97.9%, a difference of 0.010%), and Hawaiian (97.9%, a difference of 0.010%).
| Demographics | Rating | Rank | 1st Grade |
| Immigrants | Poland | 40.1 /100 | #184 | Average 97.9% |
| Immigrants | Belarus | 39.3 /100 | #185 | Fair 97.9% |
| Paiute | 36.5 /100 | #186 | Fair 97.9% |
| Pakistanis | 35.8 /100 | #187 | Fair 97.9% |
| Arabs | 35.5 /100 | #188 | Fair 97.9% |
| Immigrants | Kazakhstan | 34.9 /100 | #189 | Fair 97.9% |
| Panamanians | 34.1 /100 | #190 | Fair 97.9% |
| Blacks/African Americans | 30.7 /100 | #191 | Fair 97.9% |
| Paraguayans | 30.2 /100 | #192 | Fair 97.9% |
| Immigrants | Taiwan | 29.4 /100 | #193 | Fair 97.9% |
| Mongolians | 29.2 /100 | #194 | Fair 97.9% |
| Hawaiians | 28.8 /100 | #195 | Fair 97.9% |
| Immigrants | Kenya | 26.3 /100 | #196 | Fair 97.8% |
| Guamanians/Chamorros | 26.2 /100 | #197 | Fair 97.8% |
| Yuman | 24.4 /100 | #198 | Fair 97.8% |