English vs Black/African American Bachelor's Degree
COMPARE
English
Black/African American
Bachelor's Degree
Bachelor's Degree Comparison
English
Blacks/African Americans
37.4%
BACHELOR'S DEGREE
39.7/ 100
METRIC RATING
187th/ 347
METRIC RANK
30.9%
BACHELOR'S DEGREE
0.1/ 100
METRIC RATING
291st/ 347
METRIC RANK
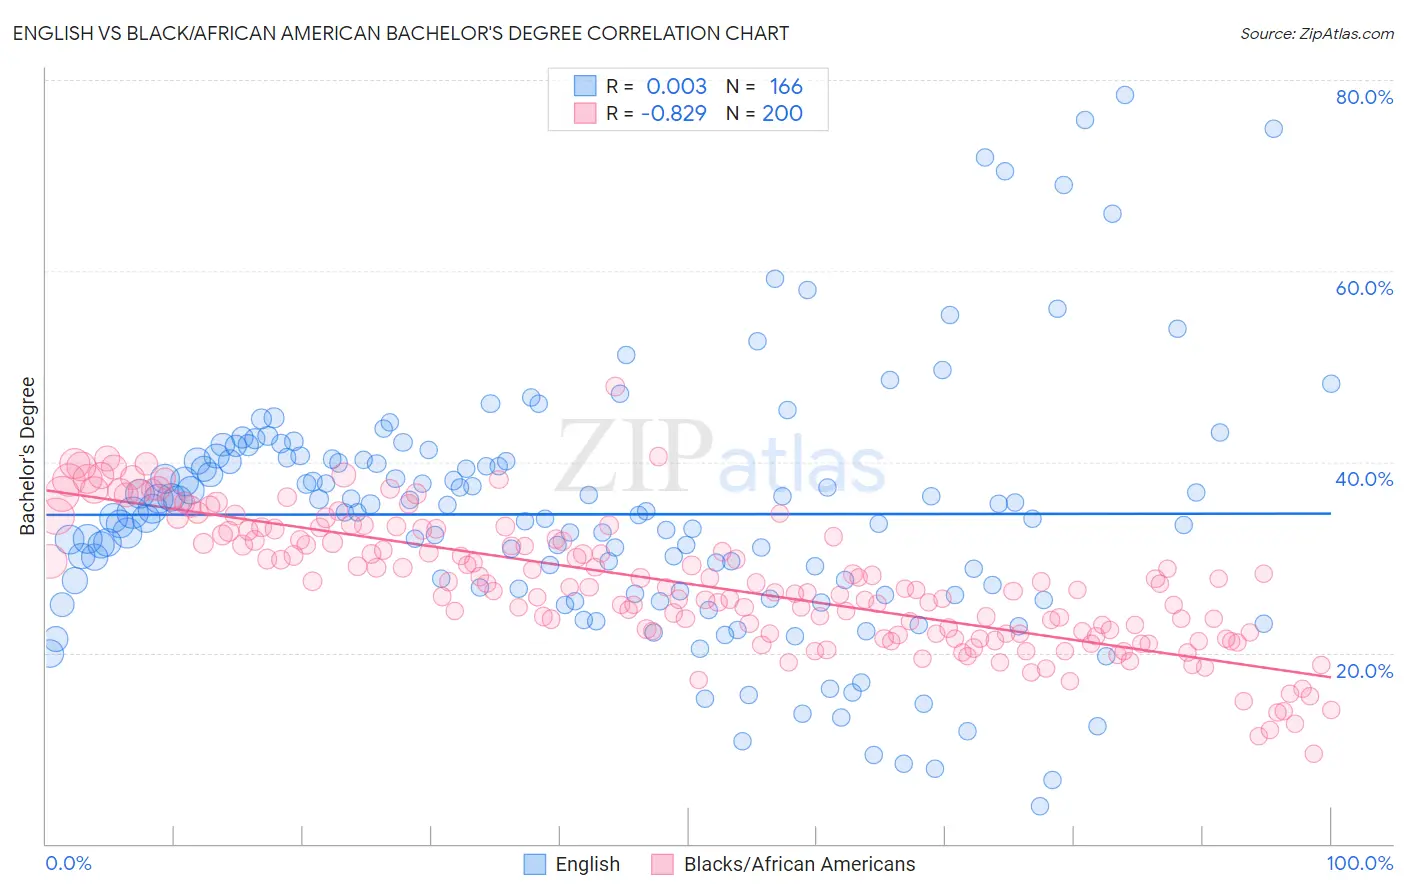
English vs Black/African American Bachelor's Degree Correlation Chart
The statistical analysis conducted on geographies consisting of 579,675,473 people shows no correlation between the proportion of English and percentage of population with at least bachelor's degree education in the United States with a correlation coefficient (R) of 0.003 and weighted average of 37.4%. Similarly, the statistical analysis conducted on geographies consisting of 565,857,967 people shows a very strong negative correlation between the proportion of Blacks/African Americans and percentage of population with at least bachelor's degree education in the United States with a correlation coefficient (R) of -0.829 and weighted average of 30.9%, a difference of 21.0%.
Bachelor's Degree Correlation Summary
| Measurement | English | Black/African American |
| Minimum | 3.9% | 9.5% |
| Maximum | 78.4% | 47.9% |
| Range | 74.5% | 38.4% |
| Mean | 34.5% | 27.2% |
| Median | 34.7% | 26.9% |
| Interquartile 25% (IQ1) | 26.5% | 22.0% |
| Interquartile 75% (IQ3) | 40.2% | 32.3% |
| Interquartile Range (IQR) | 13.8% | 10.3% |
| Standard Deviation (Sample) | 13.1% | 6.8% |
| Standard Deviation (Population) | 13.1% | 6.8% |
Similar Demographics by Bachelor's Degree
Demographics Similar to English by Bachelor's Degree
In terms of bachelor's degree, the demographic groups most similar to English are Norwegian (37.5%, a difference of 0.070%), Immigrants from Peru (37.5%, a difference of 0.17%), Scandinavian (37.5%, a difference of 0.21%), Immigrants from Oceania (37.3%, a difference of 0.24%), and Senegalese (37.5%, a difference of 0.26%).
| Demographics | Rating | Rank | Bachelor's Degree |
| Irish | 44.3 /100 | #180 | Average 37.6% |
| Immigrants | Senegal | 43.8 /100 | #181 | Average 37.6% |
| Immigrants | Bosnia and Herzegovina | 43.4 /100 | #182 | Average 37.6% |
| Senegalese | 42.2 /100 | #183 | Average 37.5% |
| Scandinavians | 41.7 /100 | #184 | Average 37.5% |
| Immigrants | Peru | 41.3 /100 | #185 | Average 37.5% |
| Norwegians | 40.4 /100 | #186 | Average 37.5% |
| English | 39.7 /100 | #187 | Fair 37.4% |
| Immigrants | Oceania | 37.3 /100 | #188 | Fair 37.3% |
| Slovaks | 36.9 /100 | #189 | Fair 37.3% |
| Swiss | 34.1 /100 | #190 | Fair 37.2% |
| Nigerians | 33.9 /100 | #191 | Fair 37.2% |
| Immigrants | Vietnam | 32.1 /100 | #192 | Fair 37.1% |
| Yugoslavians | 31.5 /100 | #193 | Fair 37.1% |
| Belgians | 29.9 /100 | #194 | Fair 37.0% |
Demographics Similar to Blacks/African Americans by Bachelor's Degree
In terms of bachelor's degree, the demographic groups most similar to Blacks/African Americans are Immigrants from Honduras (30.9%, a difference of 0.040%), Puerto Rican (31.0%, a difference of 0.080%), Ute (30.9%, a difference of 0.080%), Cape Verdean (30.9%, a difference of 0.18%), and Guatemalan (31.0%, a difference of 0.22%).
| Demographics | Rating | Rank | Bachelor's Degree |
| Haitians | 0.1 /100 | #284 | Tragic 31.3% |
| Aleuts | 0.1 /100 | #285 | Tragic 31.3% |
| Immigrants | El Salvador | 0.1 /100 | #286 | Tragic 31.3% |
| Ottawa | 0.1 /100 | #287 | Tragic 31.1% |
| Guatemalans | 0.1 /100 | #288 | Tragic 31.0% |
| Puerto Ricans | 0.1 /100 | #289 | Tragic 31.0% |
| Immigrants | Honduras | 0.1 /100 | #290 | Tragic 30.9% |
| Blacks/African Americans | 0.1 /100 | #291 | Tragic 30.9% |
| Ute | 0.1 /100 | #292 | Tragic 30.9% |
| Cape Verdeans | 0.1 /100 | #293 | Tragic 30.9% |
| Immigrants | Guatemala | 0.0 /100 | #294 | Tragic 30.8% |
| Immigrants | Dominican Republic | 0.0 /100 | #295 | Tragic 30.7% |
| Puget Sound Salish | 0.0 /100 | #296 | Tragic 30.7% |
| Immigrants | Haiti | 0.0 /100 | #297 | Tragic 30.6% |
| Chippewa | 0.0 /100 | #298 | Tragic 30.6% |