Samoan vs Immigrants from Netherlands Associate's Degree
COMPARE
Samoan
Immigrants from Netherlands
Associate's Degree
Associate's Degree Comparison
Samoans
Immigrants from Netherlands
41.1%
ASSOCIATE'S DEGREE
0.2/ 100
METRIC RATING
266th/ 347
METRIC RANK
51.4%
ASSOCIATE'S DEGREE
99.7/ 100
METRIC RATING
64th/ 347
METRIC RANK
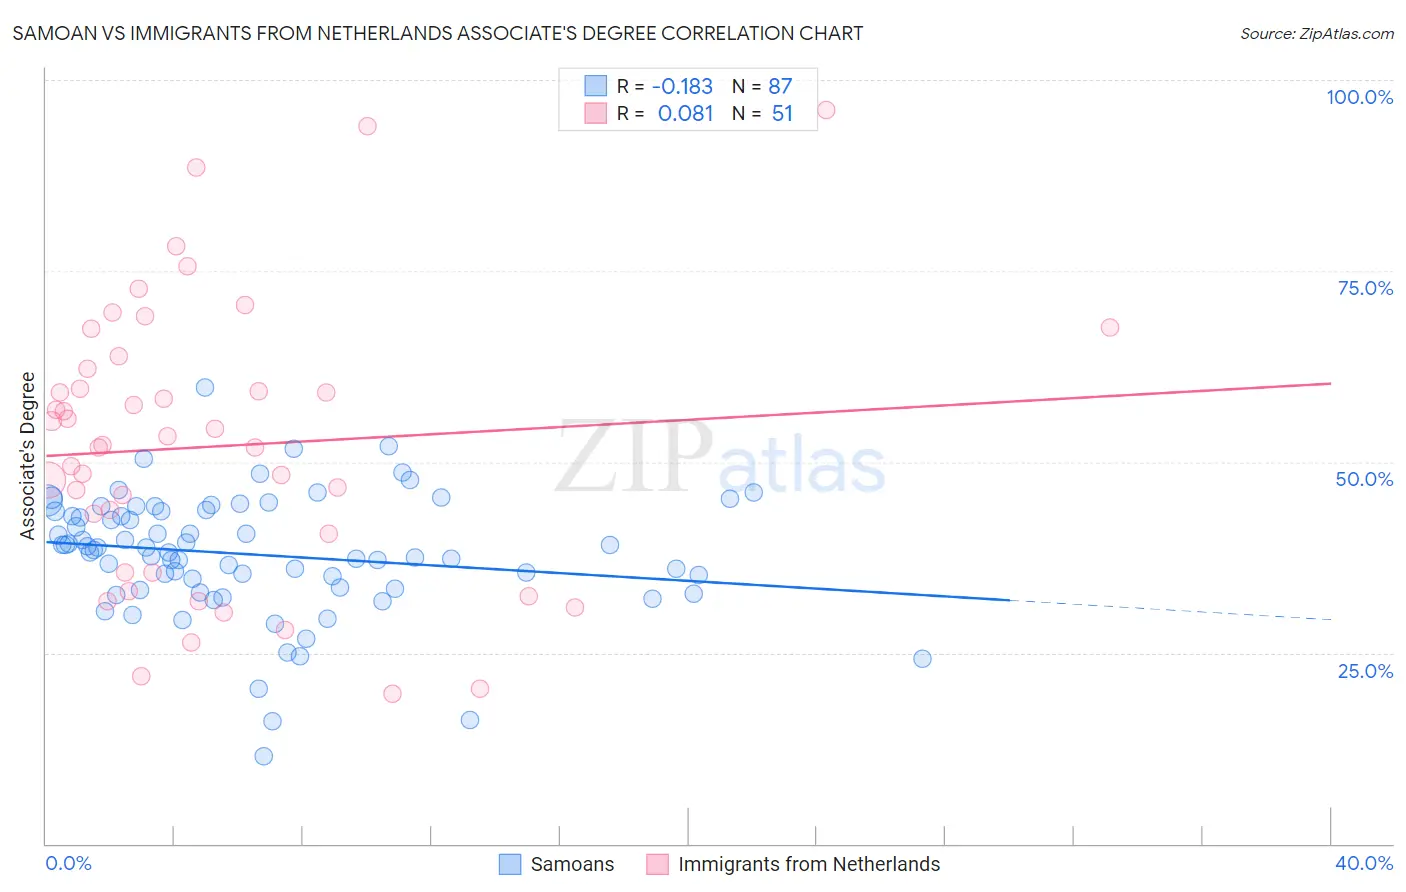
Samoan vs Immigrants from Netherlands Associate's Degree Correlation Chart
The statistical analysis conducted on geographies consisting of 225,200,067 people shows a poor negative correlation between the proportion of Samoans and percentage of population with at least associate's degree education in the United States with a correlation coefficient (R) of -0.183 and weighted average of 41.1%. Similarly, the statistical analysis conducted on geographies consisting of 237,876,631 people shows a slight positive correlation between the proportion of Immigrants from Netherlands and percentage of population with at least associate's degree education in the United States with a correlation coefficient (R) of 0.081 and weighted average of 51.4%, a difference of 24.8%.
Associate's Degree Correlation Summary
| Measurement | Samoan | Immigrants from Netherlands |
| Minimum | 11.4% | 19.6% |
| Maximum | 59.7% | 96.1% |
| Range | 48.3% | 76.5% |
| Mean | 37.8% | 52.0% |
| Median | 38.5% | 52.3% |
| Interquartile 25% (IQ1) | 33.3% | 35.5% |
| Interquartile 75% (IQ3) | 43.6% | 62.2% |
| Interquartile Range (IQR) | 10.3% | 26.7% |
| Standard Deviation (Sample) | 8.1% | 18.1% |
| Standard Deviation (Population) | 8.0% | 17.9% |
Similar Demographics by Associate's Degree
Demographics Similar to Samoans by Associate's Degree
In terms of associate's degree, the demographic groups most similar to Samoans are African (41.1%, a difference of 0.0%), Hawaiian (40.9%, a difference of 0.56%), Osage (41.5%, a difference of 0.76%), Central American Indian (40.8%, a difference of 0.76%), and Immigrants from Jamaica (41.5%, a difference of 0.77%).
| Demographics | Rating | Rank | Associate's Degree |
| Malaysians | 0.4 /100 | #259 | Tragic 41.6% |
| Marshallese | 0.4 /100 | #260 | Tragic 41.6% |
| Nicaraguans | 0.4 /100 | #261 | Tragic 41.5% |
| Bahamians | 0.4 /100 | #262 | Tragic 41.5% |
| Immigrants | Jamaica | 0.3 /100 | #263 | Tragic 41.5% |
| Osage | 0.3 /100 | #264 | Tragic 41.5% |
| Africans | 0.2 /100 | #265 | Tragic 41.1% |
| Samoans | 0.2 /100 | #266 | Tragic 41.1% |
| Hawaiians | 0.2 /100 | #267 | Tragic 40.9% |
| Central American Indians | 0.2 /100 | #268 | Tragic 40.8% |
| Americans | 0.2 /100 | #269 | Tragic 40.8% |
| Chippewa | 0.2 /100 | #270 | Tragic 40.7% |
| Immigrants | Laos | 0.1 /100 | #271 | Tragic 40.7% |
| Belizeans | 0.1 /100 | #272 | Tragic 40.6% |
| Puget Sound Salish | 0.1 /100 | #273 | Tragic 40.5% |
Demographics Similar to Immigrants from Netherlands by Associate's Degree
In terms of associate's degree, the demographic groups most similar to Immigrants from Netherlands are Zimbabwean (51.3%, a difference of 0.030%), South African (51.4%, a difference of 0.070%), Immigrants from Europe (51.3%, a difference of 0.080%), Immigrants from Kazakhstan (51.4%, a difference of 0.13%), and Bhutanese (51.4%, a difference of 0.13%).
| Demographics | Rating | Rank | Associate's Degree |
| Paraguayans | 99.8 /100 | #57 | Exceptional 51.8% |
| New Zealanders | 99.8 /100 | #58 | Exceptional 51.8% |
| Immigrants | Serbia | 99.8 /100 | #59 | Exceptional 51.7% |
| Immigrants | Bolivia | 99.7 /100 | #60 | Exceptional 51.5% |
| Immigrants | Kazakhstan | 99.7 /100 | #61 | Exceptional 51.4% |
| Bhutanese | 99.7 /100 | #62 | Exceptional 51.4% |
| South Africans | 99.7 /100 | #63 | Exceptional 51.4% |
| Immigrants | Netherlands | 99.7 /100 | #64 | Exceptional 51.4% |
| Zimbabweans | 99.7 /100 | #65 | Exceptional 51.3% |
| Immigrants | Europe | 99.7 /100 | #66 | Exceptional 51.3% |
| Argentineans | 99.6 /100 | #67 | Exceptional 51.2% |
| Immigrants | Indonesia | 99.5 /100 | #68 | Exceptional 51.0% |
| Egyptians | 99.5 /100 | #69 | Exceptional 50.9% |
| Immigrants | Argentina | 99.5 /100 | #70 | Exceptional 50.9% |
| Immigrants | Romania | 99.5 /100 | #71 | Exceptional 50.9% |