Seminole vs Immigrants from Netherlands Associate's Degree
COMPARE
Seminole
Immigrants from Netherlands
Associate's Degree
Associate's Degree Comparison
Seminole
Immigrants from Netherlands
37.7%
ASSOCIATE'S DEGREE
0.0/ 100
METRIC RATING
314th/ 347
METRIC RANK
51.4%
ASSOCIATE'S DEGREE
99.7/ 100
METRIC RATING
64th/ 347
METRIC RANK
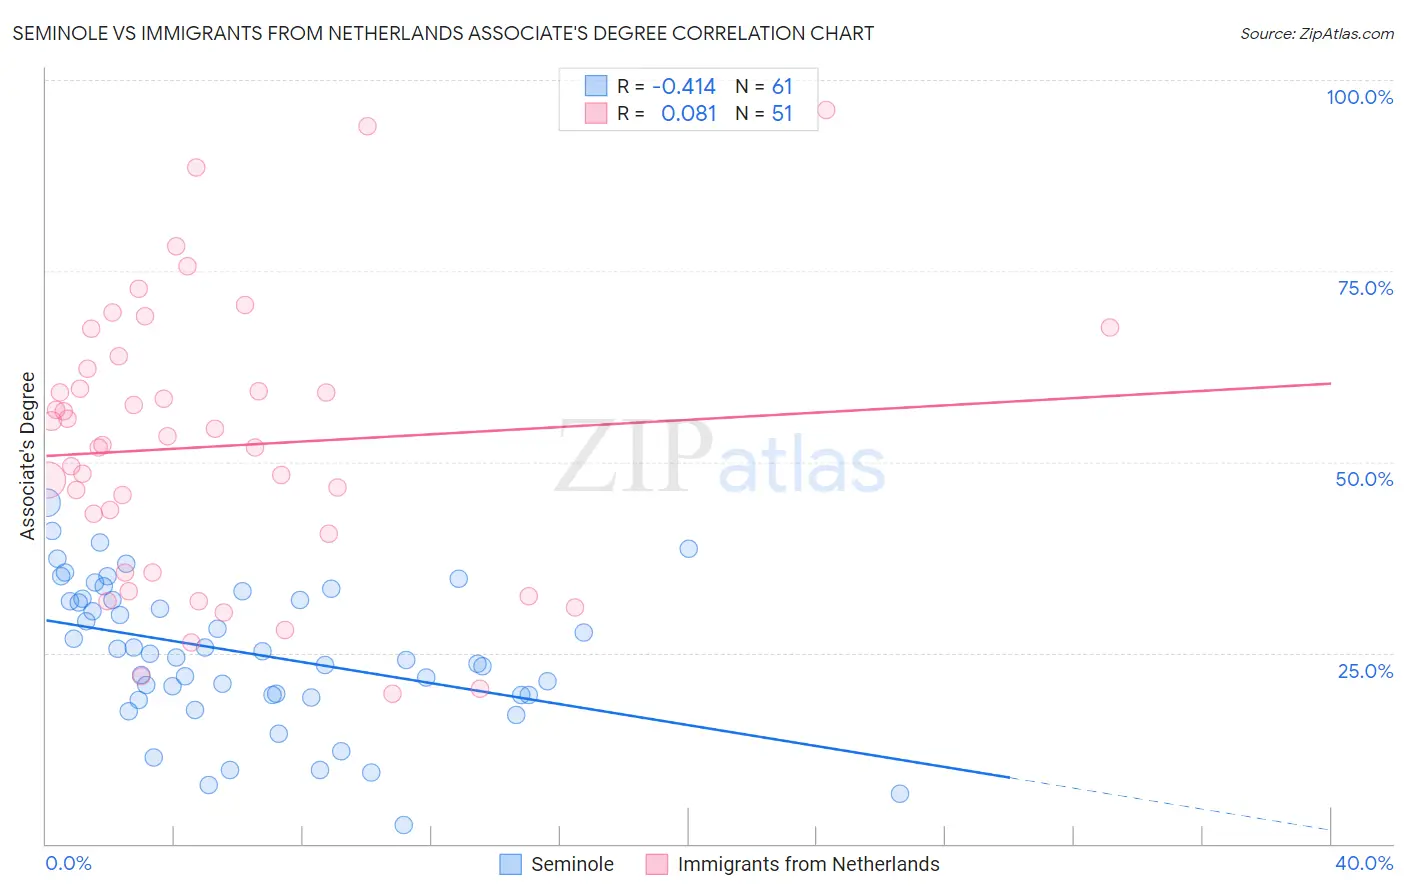
Seminole vs Immigrants from Netherlands Associate's Degree Correlation Chart
The statistical analysis conducted on geographies consisting of 118,312,703 people shows a moderate negative correlation between the proportion of Seminole and percentage of population with at least associate's degree education in the United States with a correlation coefficient (R) of -0.414 and weighted average of 37.7%. Similarly, the statistical analysis conducted on geographies consisting of 237,876,631 people shows a slight positive correlation between the proportion of Immigrants from Netherlands and percentage of population with at least associate's degree education in the United States with a correlation coefficient (R) of 0.081 and weighted average of 51.4%, a difference of 36.2%.
Associate's Degree Correlation Summary
| Measurement | Seminole | Immigrants from Netherlands |
| Minimum | 2.5% | 19.6% |
| Maximum | 44.7% | 96.1% |
| Range | 42.2% | 76.5% |
| Mean | 24.9% | 52.0% |
| Median | 24.9% | 52.3% |
| Interquartile 25% (IQ1) | 19.4% | 35.5% |
| Interquartile 75% (IQ3) | 32.1% | 62.2% |
| Interquartile Range (IQR) | 12.6% | 26.7% |
| Standard Deviation (Sample) | 9.3% | 18.1% |
| Standard Deviation (Population) | 9.2% | 17.9% |
Similar Demographics by Associate's Degree
Demographics Similar to Seminole by Associate's Degree
In terms of associate's degree, the demographic groups most similar to Seminole are Hispanic or Latino (37.7%, a difference of 0.050%), Choctaw (37.8%, a difference of 0.20%), Creek (37.6%, a difference of 0.39%), Crow (37.6%, a difference of 0.40%), and Yaqui (37.6%, a difference of 0.41%).
| Demographics | Rating | Rank | Associate's Degree |
| Immigrants | El Salvador | 0.0 /100 | #307 | Tragic 38.4% |
| Mexican American Indians | 0.0 /100 | #308 | Tragic 38.2% |
| Immigrants | Guatemala | 0.0 /100 | #309 | Tragic 38.1% |
| Immigrants | Dominican Republic | 0.0 /100 | #310 | Tragic 37.9% |
| Immigrants | Latin America | 0.0 /100 | #311 | Tragic 37.9% |
| Choctaw | 0.0 /100 | #312 | Tragic 37.8% |
| Hispanics or Latinos | 0.0 /100 | #313 | Tragic 37.7% |
| Seminole | 0.0 /100 | #314 | Tragic 37.7% |
| Creek | 0.0 /100 | #315 | Tragic 37.6% |
| Crow | 0.0 /100 | #316 | Tragic 37.6% |
| Yaqui | 0.0 /100 | #317 | Tragic 37.6% |
| Alaska Natives | 0.0 /100 | #318 | Tragic 37.5% |
| Fijians | 0.0 /100 | #319 | Tragic 37.4% |
| Cajuns | 0.0 /100 | #320 | Tragic 37.4% |
| Immigrants | Yemen | 0.0 /100 | #321 | Tragic 37.3% |
Demographics Similar to Immigrants from Netherlands by Associate's Degree
In terms of associate's degree, the demographic groups most similar to Immigrants from Netherlands are Zimbabwean (51.3%, a difference of 0.030%), South African (51.4%, a difference of 0.070%), Immigrants from Europe (51.3%, a difference of 0.080%), Immigrants from Kazakhstan (51.4%, a difference of 0.13%), and Bhutanese (51.4%, a difference of 0.13%).
| Demographics | Rating | Rank | Associate's Degree |
| Paraguayans | 99.8 /100 | #57 | Exceptional 51.8% |
| New Zealanders | 99.8 /100 | #58 | Exceptional 51.8% |
| Immigrants | Serbia | 99.8 /100 | #59 | Exceptional 51.7% |
| Immigrants | Bolivia | 99.7 /100 | #60 | Exceptional 51.5% |
| Immigrants | Kazakhstan | 99.7 /100 | #61 | Exceptional 51.4% |
| Bhutanese | 99.7 /100 | #62 | Exceptional 51.4% |
| South Africans | 99.7 /100 | #63 | Exceptional 51.4% |
| Immigrants | Netherlands | 99.7 /100 | #64 | Exceptional 51.4% |
| Zimbabweans | 99.7 /100 | #65 | Exceptional 51.3% |
| Immigrants | Europe | 99.7 /100 | #66 | Exceptional 51.3% |
| Argentineans | 99.6 /100 | #67 | Exceptional 51.2% |
| Immigrants | Indonesia | 99.5 /100 | #68 | Exceptional 51.0% |
| Egyptians | 99.5 /100 | #69 | Exceptional 50.9% |
| Immigrants | Argentina | 99.5 /100 | #70 | Exceptional 50.9% |
| Immigrants | Romania | 99.5 /100 | #71 | Exceptional 50.9% |