Samoan vs Immigrants from Cameroon Associate's Degree
COMPARE
Samoan
Immigrants from Cameroon
Associate's Degree
Associate's Degree Comparison
Samoans
Immigrants from Cameroon
41.1%
ASSOCIATE'S DEGREE
0.2/ 100
METRIC RATING
266th/ 347
METRIC RANK
45.7%
ASSOCIATE'S DEGREE
31.0/ 100
METRIC RATING
193rd/ 347
METRIC RANK
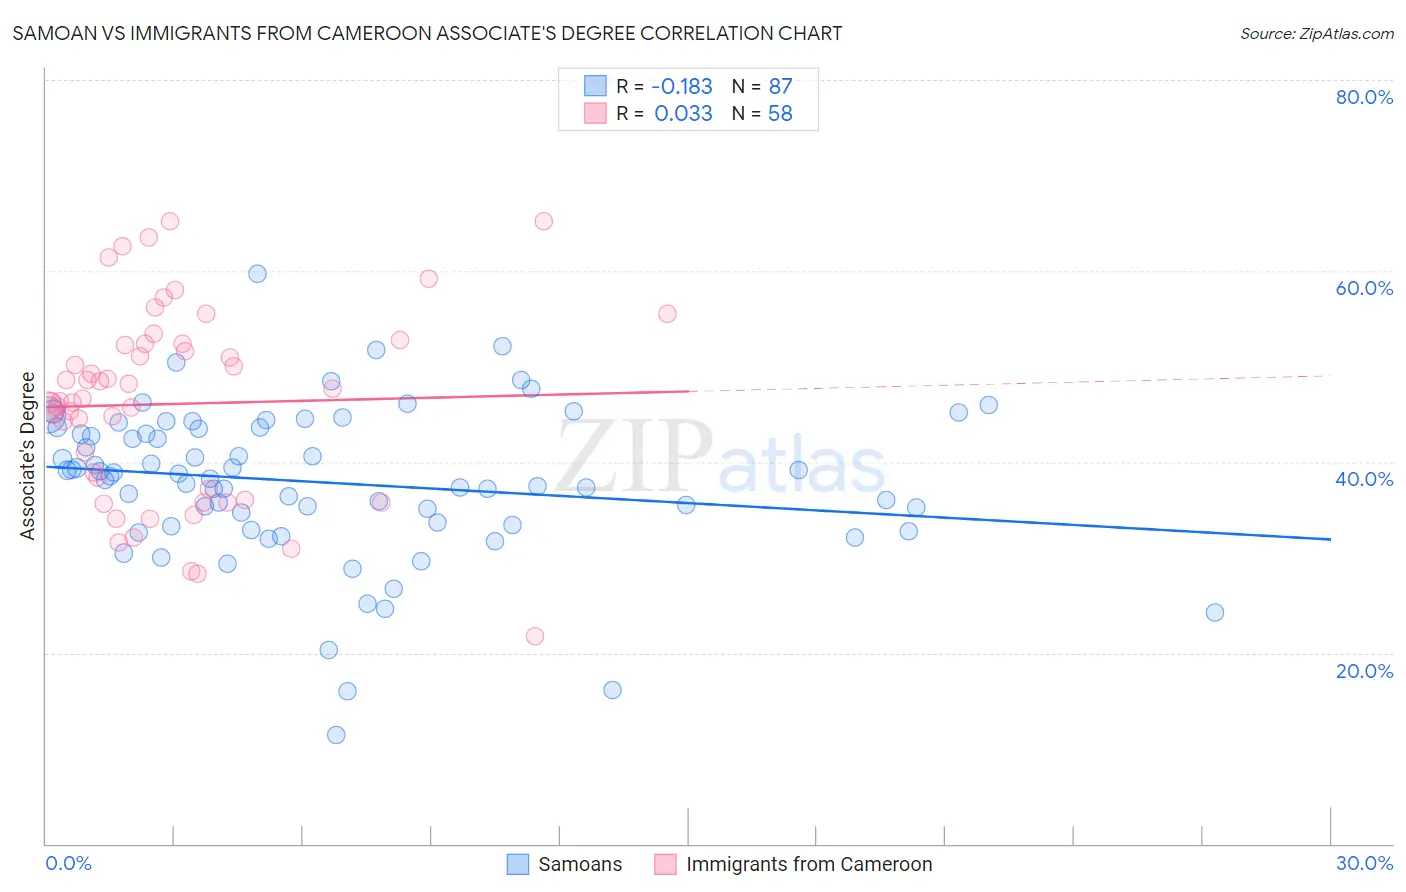
Samoan vs Immigrants from Cameroon Associate's Degree Correlation Chart
The statistical analysis conducted on geographies consisting of 225,200,067 people shows a poor negative correlation between the proportion of Samoans and percentage of population with at least associate's degree education in the United States with a correlation coefficient (R) of -0.183 and weighted average of 41.1%. Similarly, the statistical analysis conducted on geographies consisting of 130,766,713 people shows no correlation between the proportion of Immigrants from Cameroon and percentage of population with at least associate's degree education in the United States with a correlation coefficient (R) of 0.033 and weighted average of 45.7%, a difference of 11.0%.
Associate's Degree Correlation Summary
| Measurement | Samoan | Immigrants from Cameroon |
| Minimum | 11.4% | 21.7% |
| Maximum | 59.7% | 65.2% |
| Range | 48.3% | 43.4% |
| Mean | 37.8% | 46.1% |
| Median | 38.5% | 46.5% |
| Interquartile 25% (IQ1) | 33.3% | 37.1% |
| Interquartile 75% (IQ3) | 43.6% | 52.3% |
| Interquartile Range (IQR) | 10.3% | 15.2% |
| Standard Deviation (Sample) | 8.1% | 10.0% |
| Standard Deviation (Population) | 8.0% | 9.9% |
Similar Demographics by Associate's Degree
Demographics Similar to Samoans by Associate's Degree
In terms of associate's degree, the demographic groups most similar to Samoans are African (41.1%, a difference of 0.0%), Hawaiian (40.9%, a difference of 0.56%), Osage (41.5%, a difference of 0.76%), Central American Indian (40.8%, a difference of 0.76%), and Immigrants from Jamaica (41.5%, a difference of 0.77%).
| Demographics | Rating | Rank | Associate's Degree |
| Malaysians | 0.4 /100 | #259 | Tragic 41.6% |
| Marshallese | 0.4 /100 | #260 | Tragic 41.6% |
| Nicaraguans | 0.4 /100 | #261 | Tragic 41.5% |
| Bahamians | 0.4 /100 | #262 | Tragic 41.5% |
| Immigrants | Jamaica | 0.3 /100 | #263 | Tragic 41.5% |
| Osage | 0.3 /100 | #264 | Tragic 41.5% |
| Africans | 0.2 /100 | #265 | Tragic 41.1% |
| Samoans | 0.2 /100 | #266 | Tragic 41.1% |
| Hawaiians | 0.2 /100 | #267 | Tragic 40.9% |
| Central American Indians | 0.2 /100 | #268 | Tragic 40.8% |
| Americans | 0.2 /100 | #269 | Tragic 40.8% |
| Chippewa | 0.2 /100 | #270 | Tragic 40.7% |
| Immigrants | Laos | 0.1 /100 | #271 | Tragic 40.7% |
| Belizeans | 0.1 /100 | #272 | Tragic 40.6% |
| Puget Sound Salish | 0.1 /100 | #273 | Tragic 40.5% |
Demographics Similar to Immigrants from Cameroon by Associate's Degree
In terms of associate's degree, the demographic groups most similar to Immigrants from Cameroon are Celtic (45.8%, a difference of 0.20%), Korean (45.8%, a difference of 0.24%), Vietnamese (45.8%, a difference of 0.26%), Immigrants from Oceania (45.8%, a difference of 0.32%), and Immigrants from Peru (45.5%, a difference of 0.32%).
| Demographics | Rating | Rank | Associate's Degree |
| Welsh | 37.9 /100 | #186 | Fair 45.9% |
| Immigrants | Uruguay | 35.5 /100 | #187 | Fair 45.8% |
| Ghanaians | 35.5 /100 | #188 | Fair 45.8% |
| Immigrants | Oceania | 34.7 /100 | #189 | Fair 45.8% |
| Vietnamese | 34.0 /100 | #190 | Fair 45.8% |
| Koreans | 33.8 /100 | #191 | Fair 45.8% |
| Celtics | 33.3 /100 | #192 | Fair 45.8% |
| Immigrants | Cameroon | 31.0 /100 | #193 | Fair 45.7% |
| Immigrants | Peru | 27.6 /100 | #194 | Fair 45.5% |
| Germans | 26.5 /100 | #195 | Fair 45.5% |
| French | 25.6 /100 | #196 | Fair 45.4% |
| Scotch-Irish | 22.3 /100 | #197 | Fair 45.3% |
| Immigrants | Bangladesh | 21.3 /100 | #198 | Fair 45.2% |
| Immigrants | Senegal | 21.2 /100 | #199 | Fair 45.2% |
| Senegalese | 21.1 /100 | #200 | Fair 45.2% |