Samoan vs Immigrants from Brazil Associate's Degree
COMPARE
Samoan
Immigrants from Brazil
Associate's Degree
Associate's Degree Comparison
Samoans
Immigrants from Brazil
41.1%
ASSOCIATE'S DEGREE
0.2/ 100
METRIC RATING
266th/ 347
METRIC RANK
50.0%
ASSOCIATE'S DEGREE
98.5/ 100
METRIC RATING
93rd/ 347
METRIC RANK
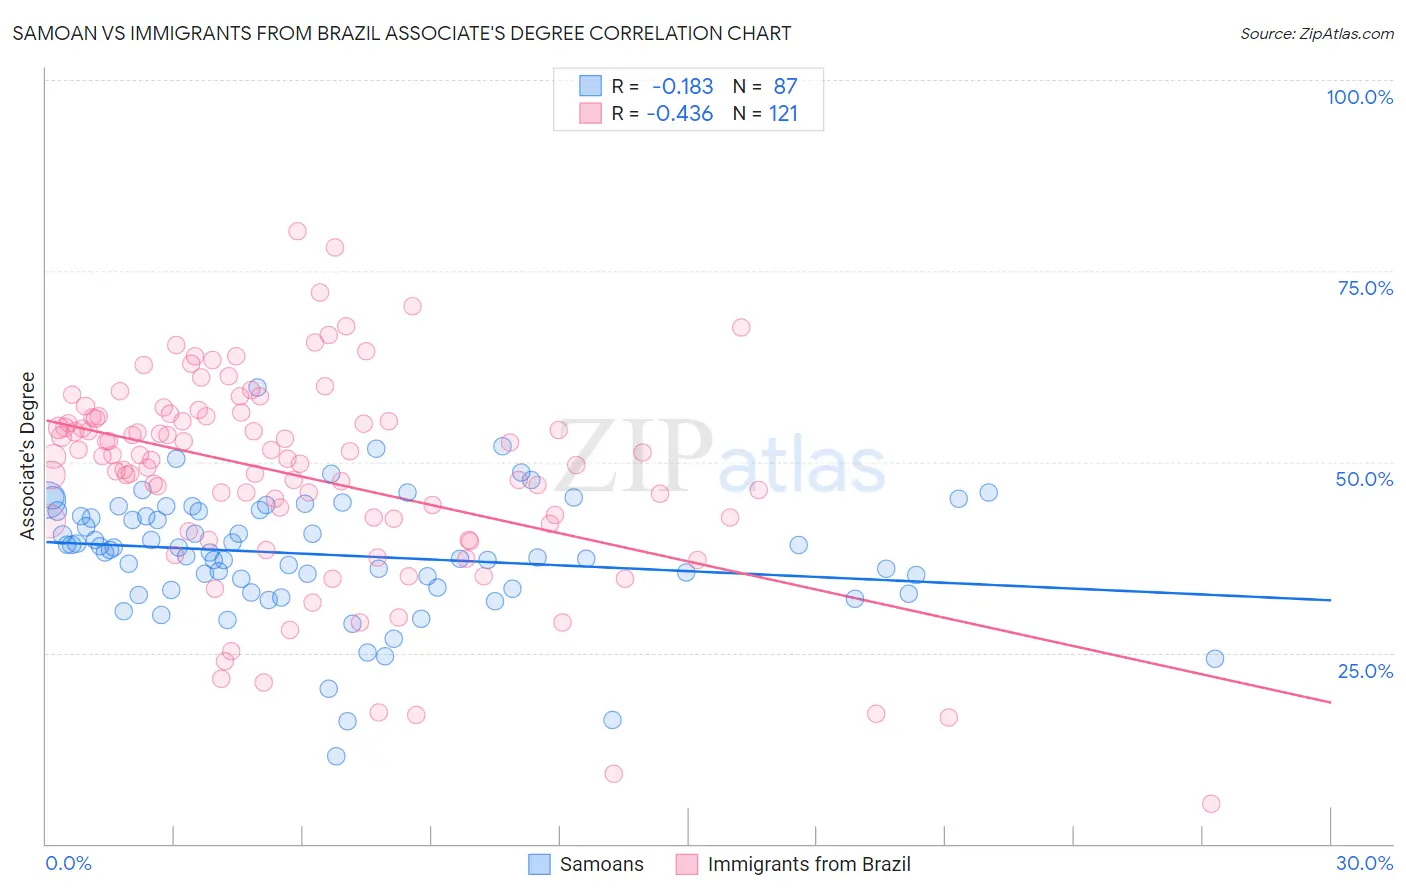
Samoan vs Immigrants from Brazil Associate's Degree Correlation Chart
The statistical analysis conducted on geographies consisting of 225,200,067 people shows a poor negative correlation between the proportion of Samoans and percentage of population with at least associate's degree education in the United States with a correlation coefficient (R) of -0.183 and weighted average of 41.1%. Similarly, the statistical analysis conducted on geographies consisting of 343,003,765 people shows a moderate negative correlation between the proportion of Immigrants from Brazil and percentage of population with at least associate's degree education in the United States with a correlation coefficient (R) of -0.436 and weighted average of 50.0%, a difference of 21.5%.
Associate's Degree Correlation Summary
| Measurement | Samoan | Immigrants from Brazil |
| Minimum | 11.4% | 5.3% |
| Maximum | 59.7% | 80.2% |
| Range | 48.3% | 75.0% |
| Mean | 37.8% | 48.1% |
| Median | 38.5% | 50.7% |
| Interquartile 25% (IQ1) | 33.3% | 42.1% |
| Interquartile 75% (IQ3) | 43.6% | 55.9% |
| Interquartile Range (IQR) | 10.3% | 13.7% |
| Standard Deviation (Sample) | 8.1% | 13.6% |
| Standard Deviation (Population) | 8.0% | 13.5% |
Similar Demographics by Associate's Degree
Demographics Similar to Samoans by Associate's Degree
In terms of associate's degree, the demographic groups most similar to Samoans are African (41.1%, a difference of 0.0%), Hawaiian (40.9%, a difference of 0.56%), Osage (41.5%, a difference of 0.76%), Central American Indian (40.8%, a difference of 0.76%), and Immigrants from Jamaica (41.5%, a difference of 0.77%).
| Demographics | Rating | Rank | Associate's Degree |
| Malaysians | 0.4 /100 | #259 | Tragic 41.6% |
| Marshallese | 0.4 /100 | #260 | Tragic 41.6% |
| Nicaraguans | 0.4 /100 | #261 | Tragic 41.5% |
| Bahamians | 0.4 /100 | #262 | Tragic 41.5% |
| Immigrants | Jamaica | 0.3 /100 | #263 | Tragic 41.5% |
| Osage | 0.3 /100 | #264 | Tragic 41.5% |
| Africans | 0.2 /100 | #265 | Tragic 41.1% |
| Samoans | 0.2 /100 | #266 | Tragic 41.1% |
| Hawaiians | 0.2 /100 | #267 | Tragic 40.9% |
| Central American Indians | 0.2 /100 | #268 | Tragic 40.8% |
| Americans | 0.2 /100 | #269 | Tragic 40.8% |
| Chippewa | 0.2 /100 | #270 | Tragic 40.7% |
| Immigrants | Laos | 0.1 /100 | #271 | Tragic 40.7% |
| Belizeans | 0.1 /100 | #272 | Tragic 40.6% |
| Puget Sound Salish | 0.1 /100 | #273 | Tragic 40.5% |
Demographics Similar to Immigrants from Brazil by Associate's Degree
In terms of associate's degree, the demographic groups most similar to Immigrants from Brazil are Laotian (49.9%, a difference of 0.13%), Immigrants from North America (50.1%, a difference of 0.15%), Immigrants from Western Asia (50.1%, a difference of 0.18%), Immigrants from Ethiopia (50.1%, a difference of 0.25%), and Immigrants from Western Europe (50.1%, a difference of 0.26%).
| Demographics | Rating | Rank | Associate's Degree |
| Immigrants | Croatia | 98.9 /100 | #86 | Exceptional 50.2% |
| Immigrants | Moldova | 98.8 /100 | #87 | Exceptional 50.2% |
| Immigrants | Canada | 98.7 /100 | #88 | Exceptional 50.1% |
| Immigrants | Western Europe | 98.7 /100 | #89 | Exceptional 50.1% |
| Immigrants | Ethiopia | 98.7 /100 | #90 | Exceptional 50.1% |
| Immigrants | Western Asia | 98.7 /100 | #91 | Exceptional 50.1% |
| Immigrants | North America | 98.7 /100 | #92 | Exceptional 50.1% |
| Immigrants | Brazil | 98.5 /100 | #93 | Exceptional 50.0% |
| Laotians | 98.4 /100 | #94 | Exceptional 49.9% |
| Immigrants | England | 98.0 /100 | #95 | Exceptional 49.7% |
| Romanians | 98.0 /100 | #96 | Exceptional 49.7% |
| Immigrants | Ukraine | 98.0 /100 | #97 | Exceptional 49.7% |
| Immigrants | Northern Africa | 97.9 /100 | #98 | Exceptional 49.7% |
| Macedonians | 97.8 /100 | #99 | Exceptional 49.6% |
| Immigrants | Nepal | 97.5 /100 | #100 | Exceptional 49.5% |