Samoan vs Immigrants from Belize Associate's Degree
COMPARE
Samoan
Immigrants from Belize
Associate's Degree
Associate's Degree Comparison
Samoans
Immigrants from Belize
41.1%
ASSOCIATE'S DEGREE
0.2/ 100
METRIC RATING
266th/ 347
METRIC RANK
39.9%
ASSOCIATE'S DEGREE
0.1/ 100
METRIC RATING
285th/ 347
METRIC RANK
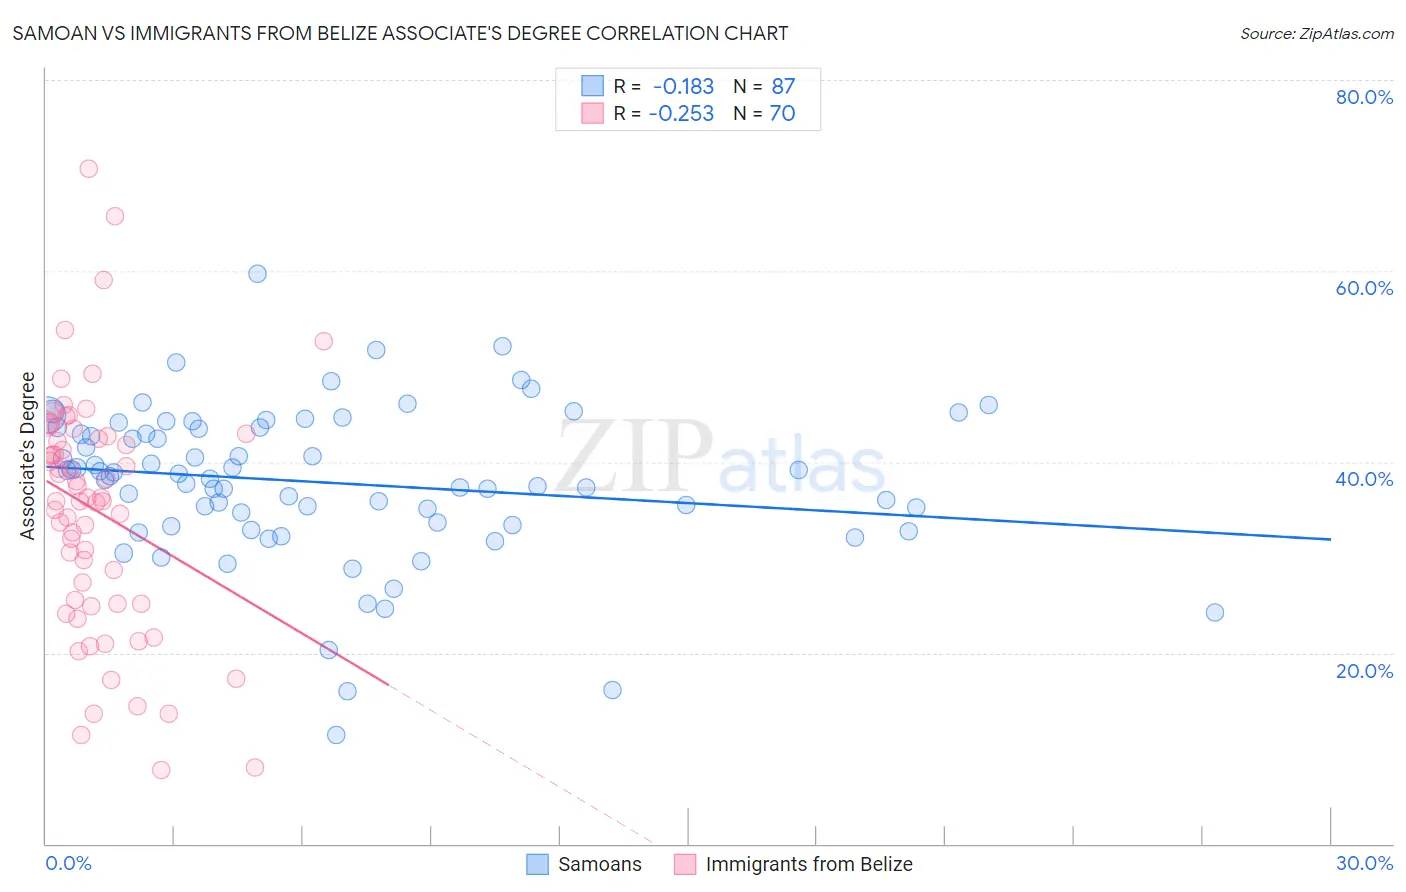
Samoan vs Immigrants from Belize Associate's Degree Correlation Chart
The statistical analysis conducted on geographies consisting of 225,200,067 people shows a poor negative correlation between the proportion of Samoans and percentage of population with at least associate's degree education in the United States with a correlation coefficient (R) of -0.183 and weighted average of 41.1%. Similarly, the statistical analysis conducted on geographies consisting of 130,322,630 people shows a weak negative correlation between the proportion of Immigrants from Belize and percentage of population with at least associate's degree education in the United States with a correlation coefficient (R) of -0.253 and weighted average of 39.9%, a difference of 3.2%.
Associate's Degree Correlation Summary
| Measurement | Samoan | Immigrants from Belize |
| Minimum | 11.4% | 7.7% |
| Maximum | 59.7% | 70.8% |
| Range | 48.3% | 63.1% |
| Mean | 37.8% | 34.9% |
| Median | 38.5% | 36.1% |
| Interquartile 25% (IQ1) | 33.3% | 25.1% |
| Interquartile 75% (IQ3) | 43.6% | 42.6% |
| Interquartile Range (IQR) | 10.3% | 17.5% |
| Standard Deviation (Sample) | 8.1% | 12.7% |
| Standard Deviation (Population) | 8.0% | 12.6% |
Demographics Similar to Samoans and Immigrants from Belize by Associate's Degree
In terms of associate's degree, the demographic groups most similar to Samoans are African (41.1%, a difference of 0.0%), Hawaiian (40.9%, a difference of 0.56%), Central American Indian (40.8%, a difference of 0.76%), American (40.8%, a difference of 0.94%), and Chippewa (40.7%, a difference of 0.99%). Similarly, the demographic groups most similar to Immigrants from Belize are Comanche (39.9%, a difference of 0.10%), Haitian (40.0%, a difference of 0.21%), Bangladeshi (40.0%, a difference of 0.36%), Immigrants from Portugal (40.1%, a difference of 0.68%), and Immigrants from Micronesia (40.2%, a difference of 0.77%).
| Demographics | Rating | Rank | Associate's Degree |
| Africans | 0.2 /100 | #265 | Tragic 41.1% |
| Samoans | 0.2 /100 | #266 | Tragic 41.1% |
| Hawaiians | 0.2 /100 | #267 | Tragic 40.9% |
| Central American Indians | 0.2 /100 | #268 | Tragic 40.8% |
| Americans | 0.2 /100 | #269 | Tragic 40.8% |
| Chippewa | 0.2 /100 | #270 | Tragic 40.7% |
| Immigrants | Laos | 0.1 /100 | #271 | Tragic 40.7% |
| Belizeans | 0.1 /100 | #272 | Tragic 40.6% |
| Puget Sound Salish | 0.1 /100 | #273 | Tragic 40.5% |
| Immigrants | Dominica | 0.1 /100 | #274 | Tragic 40.5% |
| Potawatomi | 0.1 /100 | #275 | Tragic 40.4% |
| Puerto Ricans | 0.1 /100 | #276 | Tragic 40.4% |
| Blackfeet | 0.1 /100 | #277 | Tragic 40.3% |
| Ottawa | 0.1 /100 | #278 | Tragic 40.3% |
| Immigrants | Nicaragua | 0.1 /100 | #279 | Tragic 40.3% |
| Immigrants | Micronesia | 0.1 /100 | #280 | Tragic 40.2% |
| Immigrants | Portugal | 0.1 /100 | #281 | Tragic 40.1% |
| Bangladeshis | 0.1 /100 | #282 | Tragic 40.0% |
| Haitians | 0.1 /100 | #283 | Tragic 40.0% |
| Comanche | 0.1 /100 | #284 | Tragic 39.9% |
| Immigrants | Belize | 0.1 /100 | #285 | Tragic 39.9% |