Latvian vs Immigrants from Netherlands Associate's Degree
COMPARE
Latvian
Immigrants from Netherlands
Associate's Degree
Associate's Degree Comparison
Latvians
Immigrants from Netherlands
53.9%
ASSOCIATE'S DEGREE
100.0/ 100
METRIC RATING
27th/ 347
METRIC RANK
51.4%
ASSOCIATE'S DEGREE
99.7/ 100
METRIC RATING
64th/ 347
METRIC RANK
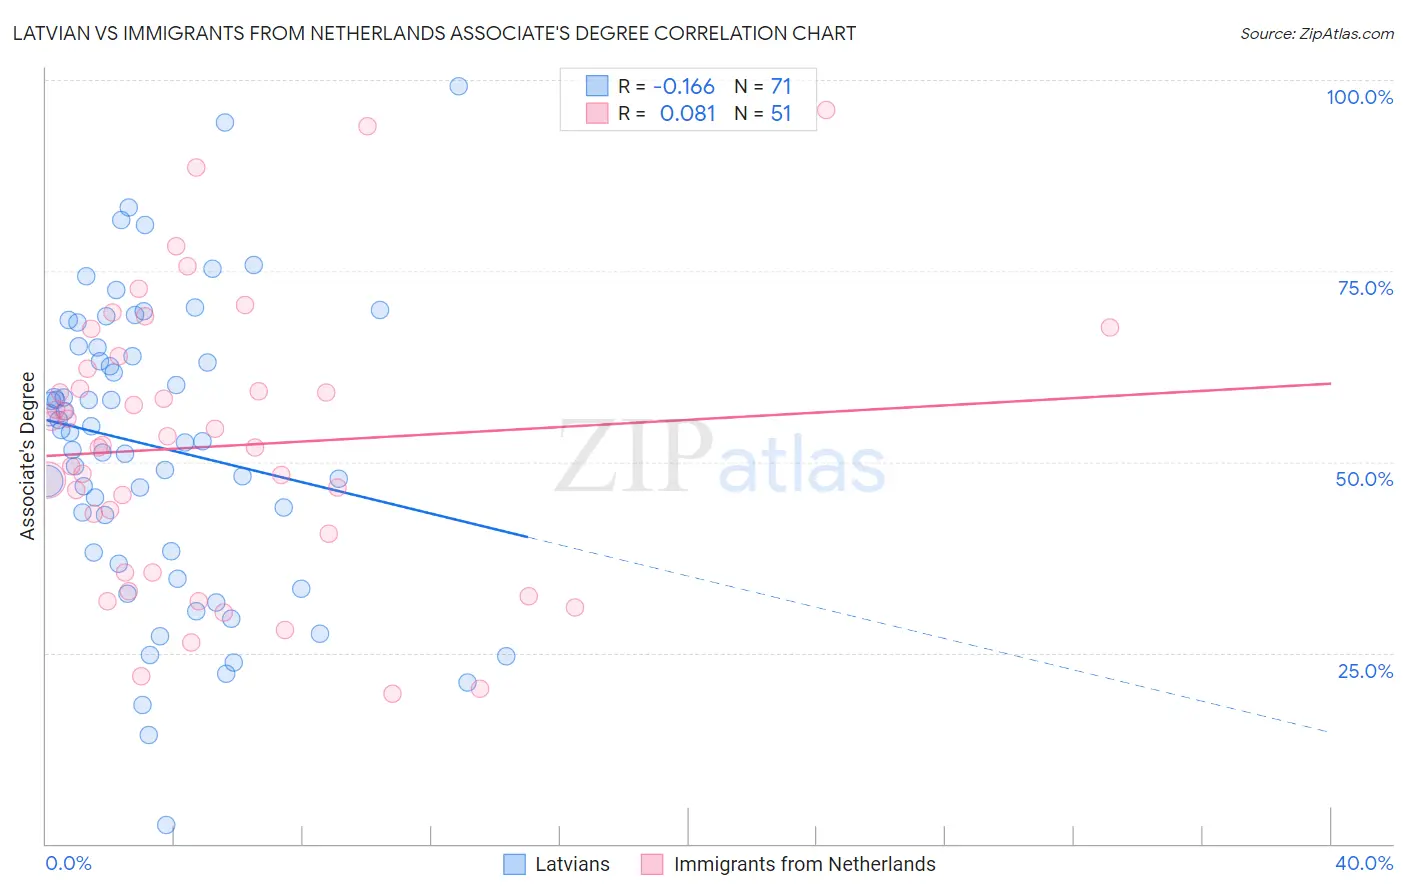
Latvian vs Immigrants from Netherlands Associate's Degree Correlation Chart
The statistical analysis conducted on geographies consisting of 220,726,880 people shows a poor negative correlation between the proportion of Latvians and percentage of population with at least associate's degree education in the United States with a correlation coefficient (R) of -0.166 and weighted average of 53.9%. Similarly, the statistical analysis conducted on geographies consisting of 237,876,631 people shows a slight positive correlation between the proportion of Immigrants from Netherlands and percentage of population with at least associate's degree education in the United States with a correlation coefficient (R) of 0.081 and weighted average of 51.4%, a difference of 5.0%.
Associate's Degree Correlation Summary
| Measurement | Latvian | Immigrants from Netherlands |
| Minimum | 2.4% | 19.6% |
| Maximum | 99.2% | 96.1% |
| Range | 96.7% | 76.5% |
| Mean | 51.9% | 52.0% |
| Median | 53.9% | 52.3% |
| Interquartile 25% (IQ1) | 38.1% | 35.5% |
| Interquartile 75% (IQ3) | 64.9% | 62.2% |
| Interquartile Range (IQR) | 26.9% | 26.7% |
| Standard Deviation (Sample) | 19.2% | 18.1% |
| Standard Deviation (Population) | 19.1% | 17.9% |
Similar Demographics by Associate's Degree
Demographics Similar to Latvians by Associate's Degree
In terms of associate's degree, the demographic groups most similar to Latvians are Turkish (53.9%, a difference of 0.070%), Immigrants from France (53.9%, a difference of 0.090%), Immigrants from Sri Lanka (53.7%, a difference of 0.50%), Immigrants from Northern Europe (53.5%, a difference of 0.87%), and Immigrants from Turkey (53.4%, a difference of 0.90%).
| Demographics | Rating | Rank | Associate's Degree |
| Cambodians | 100.0 /100 | #20 | Exceptional 54.6% |
| Immigrants | Sweden | 100.0 /100 | #21 | Exceptional 54.6% |
| Immigrants | Japan | 100.0 /100 | #22 | Exceptional 54.6% |
| Burmese | 100.0 /100 | #23 | Exceptional 54.6% |
| Immigrants | Korea | 100.0 /100 | #24 | Exceptional 54.5% |
| Immigrants | Switzerland | 100.0 /100 | #25 | Exceptional 54.5% |
| Immigrants | Belgium | 100.0 /100 | #26 | Exceptional 54.5% |
| Latvians | 100.0 /100 | #27 | Exceptional 53.9% |
| Turks | 100.0 /100 | #28 | Exceptional 53.9% |
| Immigrants | France | 100.0 /100 | #29 | Exceptional 53.9% |
| Immigrants | Sri Lanka | 100.0 /100 | #30 | Exceptional 53.7% |
| Immigrants | Northern Europe | 100.0 /100 | #31 | Exceptional 53.5% |
| Immigrants | Turkey | 100.0 /100 | #32 | Exceptional 53.4% |
| Israelis | 100.0 /100 | #33 | Exceptional 53.4% |
| Bulgarians | 100.0 /100 | #34 | Exceptional 53.3% |
Demographics Similar to Immigrants from Netherlands by Associate's Degree
In terms of associate's degree, the demographic groups most similar to Immigrants from Netherlands are Zimbabwean (51.3%, a difference of 0.030%), South African (51.4%, a difference of 0.070%), Immigrants from Europe (51.3%, a difference of 0.080%), Immigrants from Kazakhstan (51.4%, a difference of 0.13%), and Bhutanese (51.4%, a difference of 0.13%).
| Demographics | Rating | Rank | Associate's Degree |
| Paraguayans | 99.8 /100 | #57 | Exceptional 51.8% |
| New Zealanders | 99.8 /100 | #58 | Exceptional 51.8% |
| Immigrants | Serbia | 99.8 /100 | #59 | Exceptional 51.7% |
| Immigrants | Bolivia | 99.7 /100 | #60 | Exceptional 51.5% |
| Immigrants | Kazakhstan | 99.7 /100 | #61 | Exceptional 51.4% |
| Bhutanese | 99.7 /100 | #62 | Exceptional 51.4% |
| South Africans | 99.7 /100 | #63 | Exceptional 51.4% |
| Immigrants | Netherlands | 99.7 /100 | #64 | Exceptional 51.4% |
| Zimbabweans | 99.7 /100 | #65 | Exceptional 51.3% |
| Immigrants | Europe | 99.7 /100 | #66 | Exceptional 51.3% |
| Argentineans | 99.6 /100 | #67 | Exceptional 51.2% |
| Immigrants | Indonesia | 99.5 /100 | #68 | Exceptional 51.0% |
| Egyptians | 99.5 /100 | #69 | Exceptional 50.9% |
| Immigrants | Argentina | 99.5 /100 | #70 | Exceptional 50.9% |
| Immigrants | Romania | 99.5 /100 | #71 | Exceptional 50.9% |