Chinese vs Immigrants from Netherlands Associate's Degree
COMPARE
Chinese
Immigrants from Netherlands
Associate's Degree
Associate's Degree Comparison
Chinese
Immigrants from Netherlands
48.5%
ASSOCIATE'S DEGREE
92.5/ 100
METRIC RATING
125th/ 347
METRIC RANK
51.4%
ASSOCIATE'S DEGREE
99.7/ 100
METRIC RATING
64th/ 347
METRIC RANK
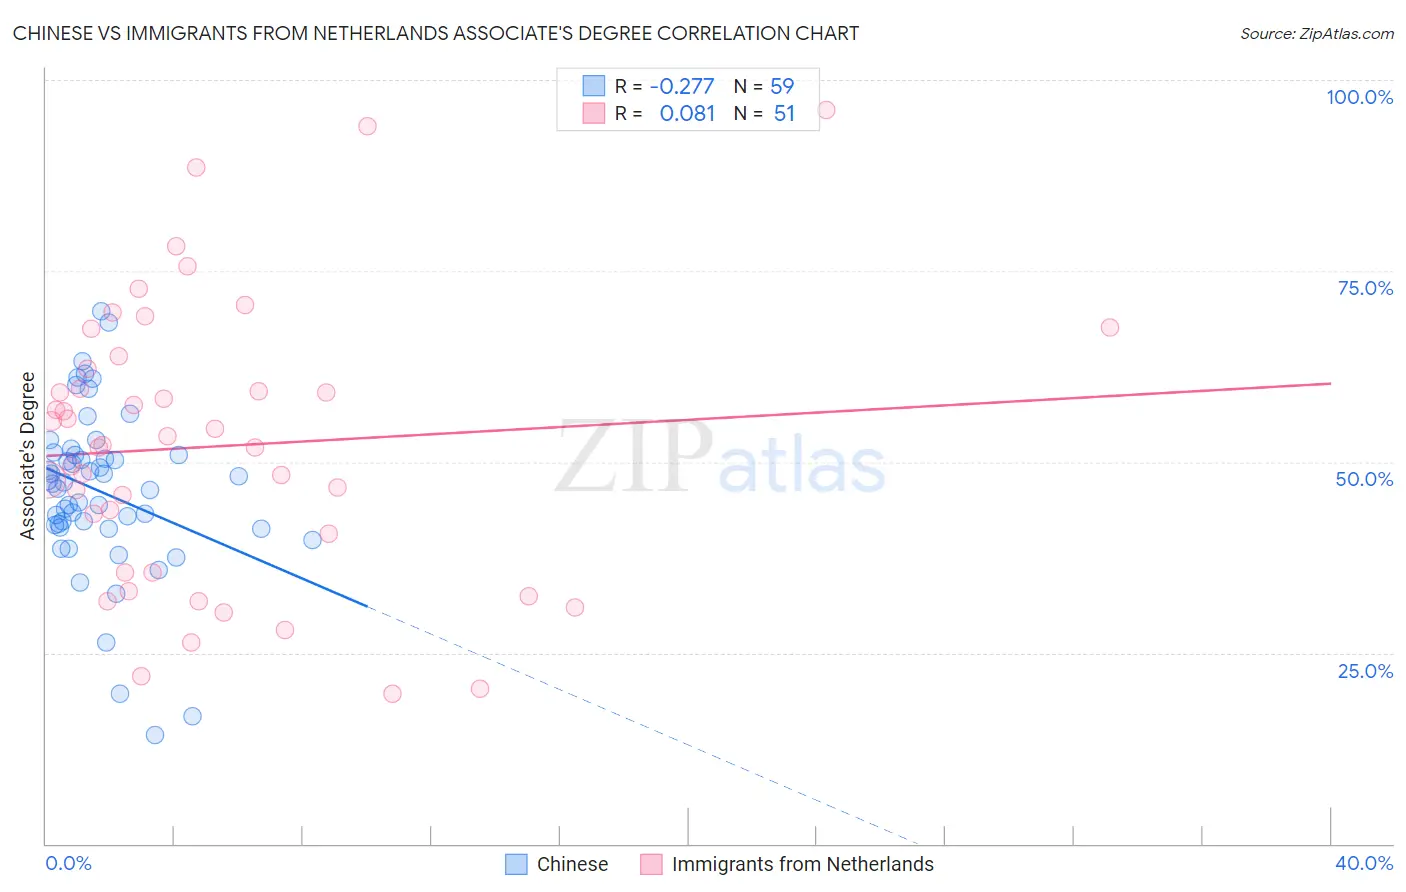
Chinese vs Immigrants from Netherlands Associate's Degree Correlation Chart
The statistical analysis conducted on geographies consisting of 64,809,883 people shows a weak negative correlation between the proportion of Chinese and percentage of population with at least associate's degree education in the United States with a correlation coefficient (R) of -0.277 and weighted average of 48.5%. Similarly, the statistical analysis conducted on geographies consisting of 237,876,631 people shows a slight positive correlation between the proportion of Immigrants from Netherlands and percentage of population with at least associate's degree education in the United States with a correlation coefficient (R) of 0.081 and weighted average of 51.4%, a difference of 5.8%.
Associate's Degree Correlation Summary
| Measurement | Chinese | Immigrants from Netherlands |
| Minimum | 14.2% | 19.6% |
| Maximum | 69.8% | 96.1% |
| Range | 55.6% | 76.5% |
| Mean | 46.1% | 52.0% |
| Median | 47.1% | 52.3% |
| Interquartile 25% (IQ1) | 41.4% | 35.5% |
| Interquartile 75% (IQ3) | 50.9% | 62.2% |
| Interquartile Range (IQR) | 9.5% | 26.7% |
| Standard Deviation (Sample) | 10.8% | 18.1% |
| Standard Deviation (Population) | 10.7% | 17.9% |
Similar Demographics by Associate's Degree
Demographics Similar to Chinese by Associate's Degree
In terms of associate's degree, the demographic groups most similar to Chinese are Serbian (48.5%, a difference of 0.020%), Immigrants from Syria (48.5%, a difference of 0.090%), Immigrants from Uganda (48.5%, a difference of 0.10%), Immigrants from Eastern Africa (48.4%, a difference of 0.22%), and Swedish (48.4%, a difference of 0.25%).
| Demographics | Rating | Rank | Associate's Degree |
| Albanians | 94.7 /100 | #118 | Exceptional 48.8% |
| Lebanese | 94.6 /100 | #119 | Exceptional 48.8% |
| Alsatians | 94.6 /100 | #120 | Exceptional 48.8% |
| Ugandans | 93.9 /100 | #121 | Exceptional 48.7% |
| Italians | 93.9 /100 | #122 | Exceptional 48.7% |
| Brazilians | 93.7 /100 | #123 | Exceptional 48.7% |
| Serbians | 92.6 /100 | #124 | Exceptional 48.5% |
| Chinese | 92.5 /100 | #125 | Exceptional 48.5% |
| Immigrants | Syria | 92.2 /100 | #126 | Exceptional 48.5% |
| Immigrants | Uganda | 92.1 /100 | #127 | Exceptional 48.5% |
| Immigrants | Eastern Africa | 91.6 /100 | #128 | Exceptional 48.4% |
| Swedes | 91.5 /100 | #129 | Exceptional 48.4% |
| Immigrants | Jordan | 91.2 /100 | #130 | Exceptional 48.4% |
| Icelanders | 90.8 /100 | #131 | Exceptional 48.3% |
| Immigrants | Albania | 89.9 /100 | #132 | Excellent 48.2% |
Demographics Similar to Immigrants from Netherlands by Associate's Degree
In terms of associate's degree, the demographic groups most similar to Immigrants from Netherlands are Zimbabwean (51.3%, a difference of 0.030%), South African (51.4%, a difference of 0.070%), Immigrants from Europe (51.3%, a difference of 0.080%), Immigrants from Kazakhstan (51.4%, a difference of 0.13%), and Bhutanese (51.4%, a difference of 0.13%).
| Demographics | Rating | Rank | Associate's Degree |
| Paraguayans | 99.8 /100 | #57 | Exceptional 51.8% |
| New Zealanders | 99.8 /100 | #58 | Exceptional 51.8% |
| Immigrants | Serbia | 99.8 /100 | #59 | Exceptional 51.7% |
| Immigrants | Bolivia | 99.7 /100 | #60 | Exceptional 51.5% |
| Immigrants | Kazakhstan | 99.7 /100 | #61 | Exceptional 51.4% |
| Bhutanese | 99.7 /100 | #62 | Exceptional 51.4% |
| South Africans | 99.7 /100 | #63 | Exceptional 51.4% |
| Immigrants | Netherlands | 99.7 /100 | #64 | Exceptional 51.4% |
| Zimbabweans | 99.7 /100 | #65 | Exceptional 51.3% |
| Immigrants | Europe | 99.7 /100 | #66 | Exceptional 51.3% |
| Argentineans | 99.6 /100 | #67 | Exceptional 51.2% |
| Immigrants | Indonesia | 99.5 /100 | #68 | Exceptional 51.0% |
| Egyptians | 99.5 /100 | #69 | Exceptional 50.9% |
| Immigrants | Argentina | 99.5 /100 | #70 | Exceptional 50.9% |
| Immigrants | Romania | 99.5 /100 | #71 | Exceptional 50.9% |