Panamanian vs Immigrants from Netherlands Associate's Degree
COMPARE
Panamanian
Immigrants from Netherlands
Associate's Degree
Associate's Degree Comparison
Panamanians
Immigrants from Netherlands
45.1%
ASSOCIATE'S DEGREE
18.4/ 100
METRIC RATING
207th/ 347
METRIC RANK
51.4%
ASSOCIATE'S DEGREE
99.7/ 100
METRIC RATING
64th/ 347
METRIC RANK
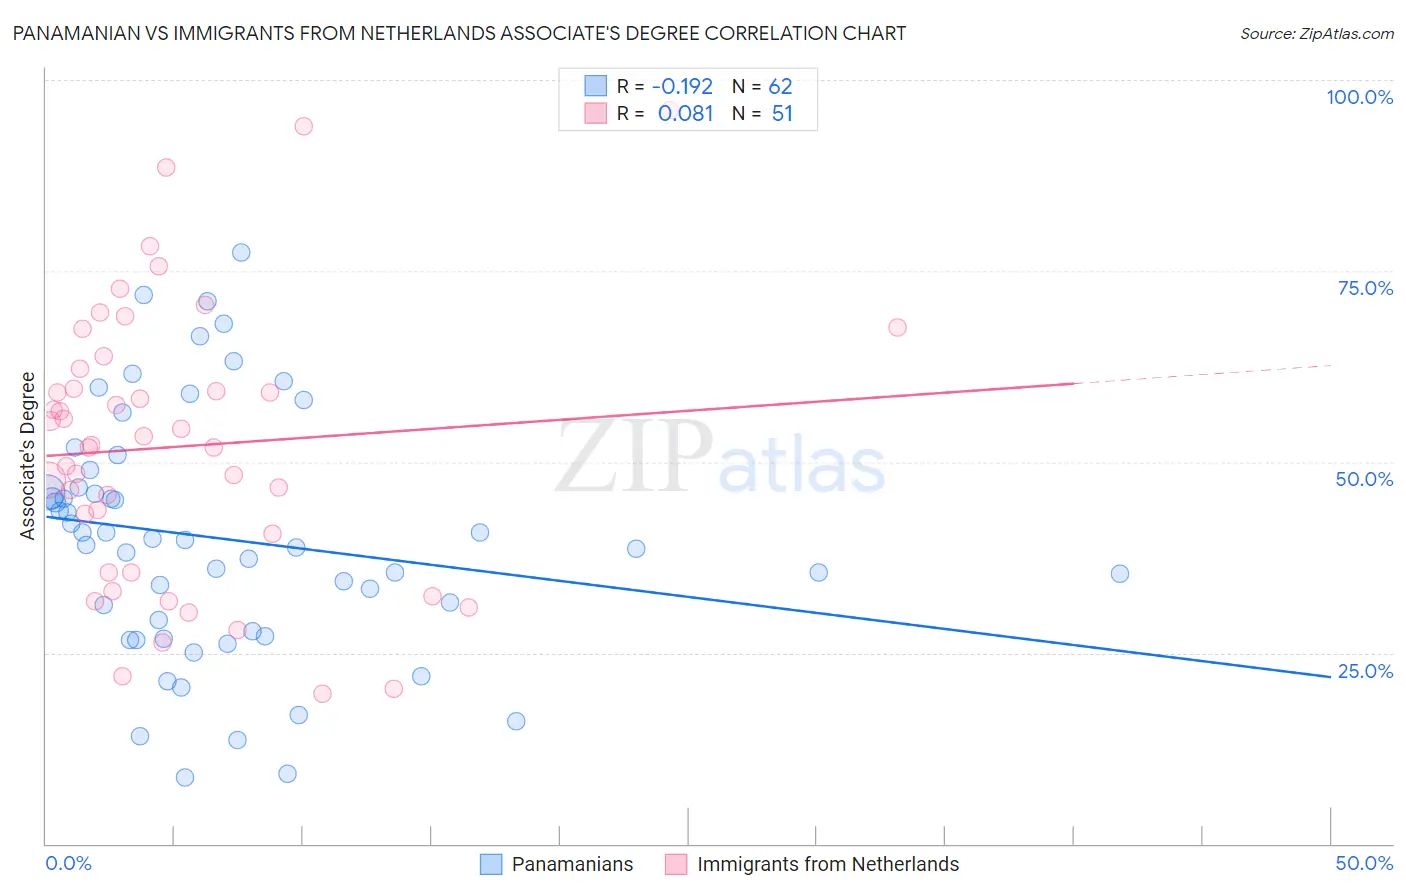
Panamanian vs Immigrants from Netherlands Associate's Degree Correlation Chart
The statistical analysis conducted on geographies consisting of 281,234,684 people shows a poor negative correlation between the proportion of Panamanians and percentage of population with at least associate's degree education in the United States with a correlation coefficient (R) of -0.192 and weighted average of 45.1%. Similarly, the statistical analysis conducted on geographies consisting of 237,876,631 people shows a slight positive correlation between the proportion of Immigrants from Netherlands and percentage of population with at least associate's degree education in the United States with a correlation coefficient (R) of 0.081 and weighted average of 51.4%, a difference of 14.0%.
Associate's Degree Correlation Summary
| Measurement | Panamanian | Immigrants from Netherlands |
| Minimum | 8.6% | 19.6% |
| Maximum | 77.4% | 96.1% |
| Range | 68.8% | 76.5% |
| Mean | 39.9% | 52.0% |
| Median | 39.4% | 52.3% |
| Interquartile 25% (IQ1) | 27.9% | 35.5% |
| Interquartile 75% (IQ3) | 46.6% | 62.2% |
| Interquartile Range (IQR) | 18.7% | 26.7% |
| Standard Deviation (Sample) | 15.9% | 18.1% |
| Standard Deviation (Population) | 15.8% | 17.9% |
Similar Demographics by Associate's Degree
Demographics Similar to Panamanians by Associate's Degree
In terms of associate's degree, the demographic groups most similar to Panamanians are Immigrants from Thailand (45.1%, a difference of 0.070%), German Russian (45.1%, a difference of 0.070%), Nigerian (45.1%, a difference of 0.090%), Dutch (45.0%, a difference of 0.10%), and Immigrants from Costa Rica (45.0%, a difference of 0.22%).
| Demographics | Rating | Rank | Associate's Degree |
| Senegalese | 21.1 /100 | #200 | Fair 45.2% |
| Immigrants | Vietnam | 20.8 /100 | #201 | Fair 45.2% |
| Spaniards | 20.4 /100 | #202 | Fair 45.2% |
| Immigrants | South Eastern Asia | 20.2 /100 | #203 | Fair 45.2% |
| Nigerians | 19.1 /100 | #204 | Poor 45.1% |
| Immigrants | Thailand | 18.9 /100 | #205 | Poor 45.1% |
| German Russians | 18.9 /100 | #206 | Poor 45.1% |
| Panamanians | 18.4 /100 | #207 | Poor 45.1% |
| Dutch | 17.6 /100 | #208 | Poor 45.0% |
| Immigrants | Costa Rica | 16.7 /100 | #209 | Poor 45.0% |
| Immigrants | Philippines | 16.7 /100 | #210 | Poor 45.0% |
| Immigrants | Zaire | 16.6 /100 | #211 | Poor 45.0% |
| French Canadians | 15.0 /100 | #212 | Poor 44.9% |
| Immigrants | Ghana | 14.2 /100 | #213 | Poor 44.8% |
| Immigrants | Middle Africa | 12.7 /100 | #214 | Poor 44.7% |
Demographics Similar to Immigrants from Netherlands by Associate's Degree
In terms of associate's degree, the demographic groups most similar to Immigrants from Netherlands are Zimbabwean (51.3%, a difference of 0.030%), South African (51.4%, a difference of 0.070%), Immigrants from Europe (51.3%, a difference of 0.080%), Immigrants from Kazakhstan (51.4%, a difference of 0.13%), and Bhutanese (51.4%, a difference of 0.13%).
| Demographics | Rating | Rank | Associate's Degree |
| Paraguayans | 99.8 /100 | #57 | Exceptional 51.8% |
| New Zealanders | 99.8 /100 | #58 | Exceptional 51.8% |
| Immigrants | Serbia | 99.8 /100 | #59 | Exceptional 51.7% |
| Immigrants | Bolivia | 99.7 /100 | #60 | Exceptional 51.5% |
| Immigrants | Kazakhstan | 99.7 /100 | #61 | Exceptional 51.4% |
| Bhutanese | 99.7 /100 | #62 | Exceptional 51.4% |
| South Africans | 99.7 /100 | #63 | Exceptional 51.4% |
| Immigrants | Netherlands | 99.7 /100 | #64 | Exceptional 51.4% |
| Zimbabweans | 99.7 /100 | #65 | Exceptional 51.3% |
| Immigrants | Europe | 99.7 /100 | #66 | Exceptional 51.3% |
| Argentineans | 99.6 /100 | #67 | Exceptional 51.2% |
| Immigrants | Indonesia | 99.5 /100 | #68 | Exceptional 51.0% |
| Egyptians | 99.5 /100 | #69 | Exceptional 50.9% |
| Immigrants | Argentina | 99.5 /100 | #70 | Exceptional 50.9% |
| Immigrants | Romania | 99.5 /100 | #71 | Exceptional 50.9% |