West Indian vs Immigrants from Netherlands Associate's Degree
COMPARE
West Indian
Immigrants from Netherlands
Associate's Degree
Associate's Degree Comparison
West Indians
Immigrants from Netherlands
43.8%
ASSOCIATE'S DEGREE
5.2/ 100
METRIC RATING
224th/ 347
METRIC RANK
51.4%
ASSOCIATE'S DEGREE
99.7/ 100
METRIC RATING
64th/ 347
METRIC RANK
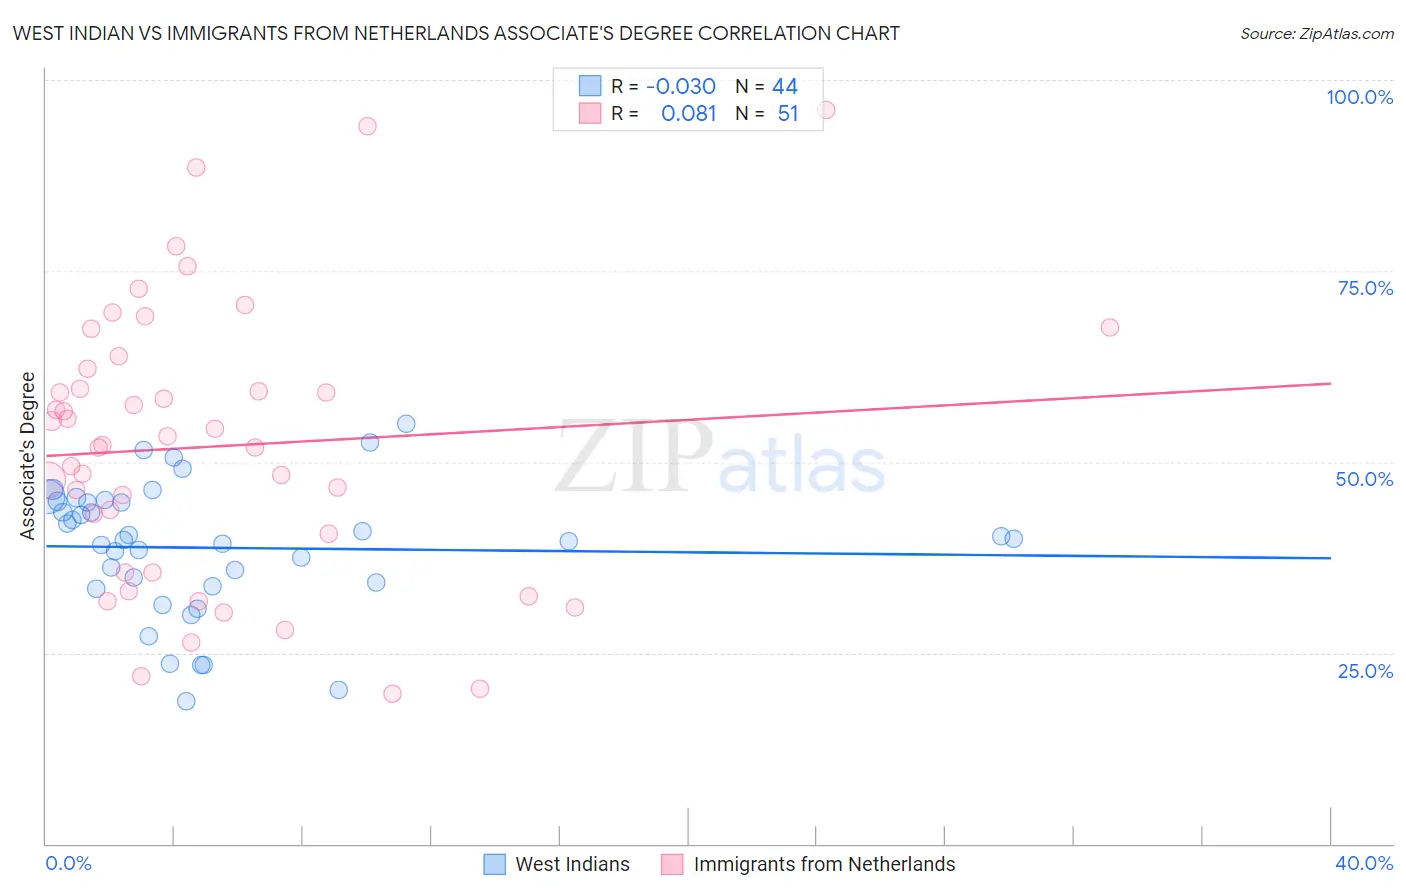
West Indian vs Immigrants from Netherlands Associate's Degree Correlation Chart
The statistical analysis conducted on geographies consisting of 254,053,499 people shows no correlation between the proportion of West Indians and percentage of population with at least associate's degree education in the United States with a correlation coefficient (R) of -0.030 and weighted average of 43.8%. Similarly, the statistical analysis conducted on geographies consisting of 237,876,631 people shows a slight positive correlation between the proportion of Immigrants from Netherlands and percentage of population with at least associate's degree education in the United States with a correlation coefficient (R) of 0.081 and weighted average of 51.4%, a difference of 17.2%.
Associate's Degree Correlation Summary
| Measurement | West Indian | Immigrants from Netherlands |
| Minimum | 18.6% | 19.6% |
| Maximum | 54.9% | 96.1% |
| Range | 36.3% | 76.5% |
| Mean | 38.7% | 52.0% |
| Median | 39.8% | 52.3% |
| Interquartile 25% (IQ1) | 33.9% | 35.5% |
| Interquartile 75% (IQ3) | 44.7% | 62.2% |
| Interquartile Range (IQR) | 10.8% | 26.7% |
| Standard Deviation (Sample) | 8.6% | 18.1% |
| Standard Deviation (Population) | 8.5% | 17.9% |
Similar Demographics by Associate's Degree
Demographics Similar to West Indians by Associate's Degree
In terms of associate's degree, the demographic groups most similar to West Indians are Subsaharan African (43.9%, a difference of 0.14%), Guamanian/Chamorro (43.8%, a difference of 0.15%), Barbadian (43.9%, a difference of 0.24%), Immigrants from Burma/Myanmar (43.7%, a difference of 0.37%), and Immigrants from Western Africa (44.1%, a difference of 0.51%).
| Demographics | Rating | Rank | Associate's Degree |
| Immigrants | Immigrants | 10.5 /100 | #217 | Poor 44.5% |
| Spanish | 9.4 /100 | #218 | Tragic 44.4% |
| Whites/Caucasians | 7.5 /100 | #219 | Tragic 44.2% |
| Portuguese | 7.2 /100 | #220 | Tragic 44.1% |
| Immigrants | Western Africa | 6.6 /100 | #221 | Tragic 44.1% |
| Barbadians | 5.8 /100 | #222 | Tragic 43.9% |
| Sub-Saharan Africans | 5.5 /100 | #223 | Tragic 43.9% |
| West Indians | 5.2 /100 | #224 | Tragic 43.8% |
| Guamanians/Chamorros | 4.8 /100 | #225 | Tragic 43.8% |
| Immigrants | Burma/Myanmar | 4.3 /100 | #226 | Tragic 43.7% |
| Trinidadians and Tobagonians | 4.0 /100 | #227 | Tragic 43.6% |
| Hmong | 3.2 /100 | #228 | Tragic 43.4% |
| Immigrants | Trinidad and Tobago | 3.0 /100 | #229 | Tragic 43.3% |
| Immigrants | Barbados | 2.9 /100 | #230 | Tragic 43.3% |
| Liberians | 2.9 /100 | #231 | Tragic 43.3% |
Demographics Similar to Immigrants from Netherlands by Associate's Degree
In terms of associate's degree, the demographic groups most similar to Immigrants from Netherlands are Zimbabwean (51.3%, a difference of 0.030%), South African (51.4%, a difference of 0.070%), Immigrants from Europe (51.3%, a difference of 0.080%), Immigrants from Kazakhstan (51.4%, a difference of 0.13%), and Bhutanese (51.4%, a difference of 0.13%).
| Demographics | Rating | Rank | Associate's Degree |
| Paraguayans | 99.8 /100 | #57 | Exceptional 51.8% |
| New Zealanders | 99.8 /100 | #58 | Exceptional 51.8% |
| Immigrants | Serbia | 99.8 /100 | #59 | Exceptional 51.7% |
| Immigrants | Bolivia | 99.7 /100 | #60 | Exceptional 51.5% |
| Immigrants | Kazakhstan | 99.7 /100 | #61 | Exceptional 51.4% |
| Bhutanese | 99.7 /100 | #62 | Exceptional 51.4% |
| South Africans | 99.7 /100 | #63 | Exceptional 51.4% |
| Immigrants | Netherlands | 99.7 /100 | #64 | Exceptional 51.4% |
| Zimbabweans | 99.7 /100 | #65 | Exceptional 51.3% |
| Immigrants | Europe | 99.7 /100 | #66 | Exceptional 51.3% |
| Argentineans | 99.6 /100 | #67 | Exceptional 51.2% |
| Immigrants | Indonesia | 99.5 /100 | #68 | Exceptional 51.0% |
| Egyptians | 99.5 /100 | #69 | Exceptional 50.9% |
| Immigrants | Argentina | 99.5 /100 | #70 | Exceptional 50.9% |
| Immigrants | Romania | 99.5 /100 | #71 | Exceptional 50.9% |