Cape Verdean vs Immigrants from Netherlands Associate's Degree
COMPARE
Cape Verdean
Immigrants from Netherlands
Associate's Degree
Associate's Degree Comparison
Cape Verdeans
Immigrants from Netherlands
38.8%
ASSOCIATE'S DEGREE
0.0/ 100
METRIC RATING
297th/ 347
METRIC RANK
51.4%
ASSOCIATE'S DEGREE
99.7/ 100
METRIC RATING
64th/ 347
METRIC RANK
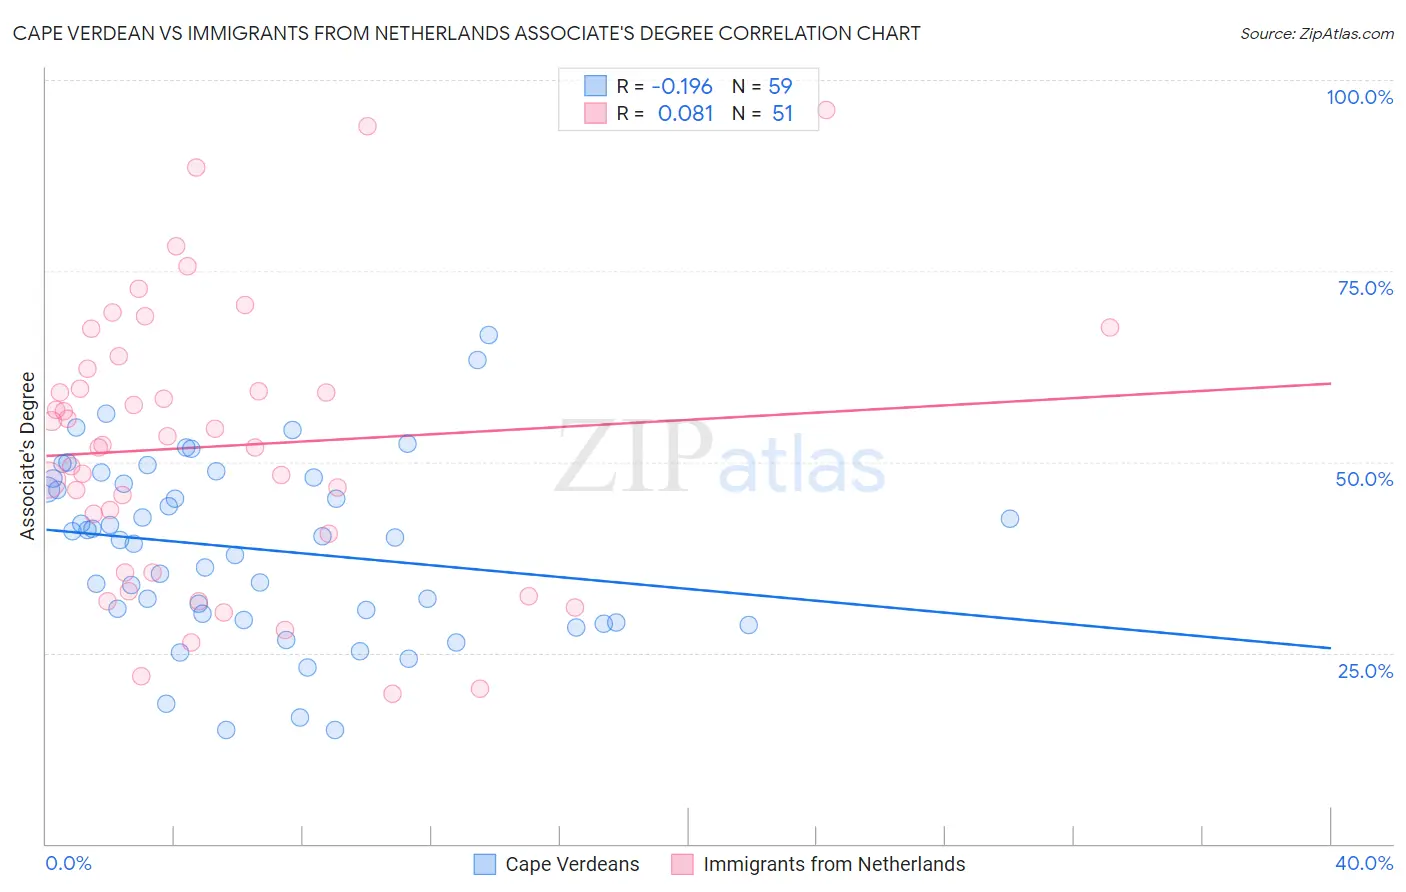
Cape Verdean vs Immigrants from Netherlands Associate's Degree Correlation Chart
The statistical analysis conducted on geographies consisting of 107,580,652 people shows a poor negative correlation between the proportion of Cape Verdeans and percentage of population with at least associate's degree education in the United States with a correlation coefficient (R) of -0.196 and weighted average of 38.8%. Similarly, the statistical analysis conducted on geographies consisting of 237,876,631 people shows a slight positive correlation between the proportion of Immigrants from Netherlands and percentage of population with at least associate's degree education in the United States with a correlation coefficient (R) of 0.081 and weighted average of 51.4%, a difference of 32.5%.
Associate's Degree Correlation Summary
| Measurement | Cape Verdean | Immigrants from Netherlands |
| Minimum | 14.9% | 19.6% |
| Maximum | 66.6% | 96.1% |
| Range | 51.7% | 76.5% |
| Mean | 38.6% | 52.0% |
| Median | 40.1% | 52.3% |
| Interquartile 25% (IQ1) | 29.3% | 35.5% |
| Interquartile 75% (IQ3) | 47.9% | 62.2% |
| Interquartile Range (IQR) | 18.6% | 26.7% |
| Standard Deviation (Sample) | 11.7% | 18.1% |
| Standard Deviation (Population) | 11.6% | 17.9% |
Similar Demographics by Associate's Degree
Demographics Similar to Cape Verdeans by Associate's Degree
In terms of associate's degree, the demographic groups most similar to Cape Verdeans are Cheyenne (38.7%, a difference of 0.26%), Cherokee (38.9%, a difference of 0.28%), Ute (38.6%, a difference of 0.36%), Chickasaw (38.6%, a difference of 0.40%), and Honduran (38.9%, a difference of 0.45%).
| Demographics | Rating | Rank | Associate's Degree |
| Immigrants | Haiti | 0.0 /100 | #290 | Tragic 39.3% |
| Dominicans | 0.0 /100 | #291 | Tragic 39.3% |
| Blacks/African Americans | 0.0 /100 | #292 | Tragic 39.1% |
| Nepalese | 0.0 /100 | #293 | Tragic 39.0% |
| Salvadorans | 0.0 /100 | #294 | Tragic 39.0% |
| Hondurans | 0.0 /100 | #295 | Tragic 38.9% |
| Cherokee | 0.0 /100 | #296 | Tragic 38.9% |
| Cape Verdeans | 0.0 /100 | #297 | Tragic 38.8% |
| Cheyenne | 0.0 /100 | #298 | Tragic 38.7% |
| Ute | 0.0 /100 | #299 | Tragic 38.6% |
| Chickasaw | 0.0 /100 | #300 | Tragic 38.6% |
| Tsimshian | 0.0 /100 | #301 | Tragic 38.6% |
| Colville | 0.0 /100 | #302 | Tragic 38.5% |
| Guatemalans | 0.0 /100 | #303 | Tragic 38.5% |
| Sioux | 0.0 /100 | #304 | Tragic 38.5% |
Demographics Similar to Immigrants from Netherlands by Associate's Degree
In terms of associate's degree, the demographic groups most similar to Immigrants from Netherlands are Zimbabwean (51.3%, a difference of 0.030%), South African (51.4%, a difference of 0.070%), Immigrants from Europe (51.3%, a difference of 0.080%), Immigrants from Kazakhstan (51.4%, a difference of 0.13%), and Bhutanese (51.4%, a difference of 0.13%).
| Demographics | Rating | Rank | Associate's Degree |
| Paraguayans | 99.8 /100 | #57 | Exceptional 51.8% |
| New Zealanders | 99.8 /100 | #58 | Exceptional 51.8% |
| Immigrants | Serbia | 99.8 /100 | #59 | Exceptional 51.7% |
| Immigrants | Bolivia | 99.7 /100 | #60 | Exceptional 51.5% |
| Immigrants | Kazakhstan | 99.7 /100 | #61 | Exceptional 51.4% |
| Bhutanese | 99.7 /100 | #62 | Exceptional 51.4% |
| South Africans | 99.7 /100 | #63 | Exceptional 51.4% |
| Immigrants | Netherlands | 99.7 /100 | #64 | Exceptional 51.4% |
| Zimbabweans | 99.7 /100 | #65 | Exceptional 51.3% |
| Immigrants | Europe | 99.7 /100 | #66 | Exceptional 51.3% |
| Argentineans | 99.6 /100 | #67 | Exceptional 51.2% |
| Immigrants | Indonesia | 99.5 /100 | #68 | Exceptional 51.0% |
| Egyptians | 99.5 /100 | #69 | Exceptional 50.9% |
| Immigrants | Argentina | 99.5 /100 | #70 | Exceptional 50.9% |
| Immigrants | Romania | 99.5 /100 | #71 | Exceptional 50.9% |