Russian vs Immigrants from Zaire College, 1 year or more
COMPARE
Russian
Immigrants from Zaire
College, 1 year or more
College, 1 year or more Comparison
Russians
Immigrants from Zaire
65.1%
COLLEGE, 1 YEAR OR MORE
99.9/ 100
METRIC RATING
37th/ 347
METRIC RANK
58.3%
COLLEGE, 1 YEAR OR MORE
18.7/ 100
METRIC RATING
205th/ 347
METRIC RANK
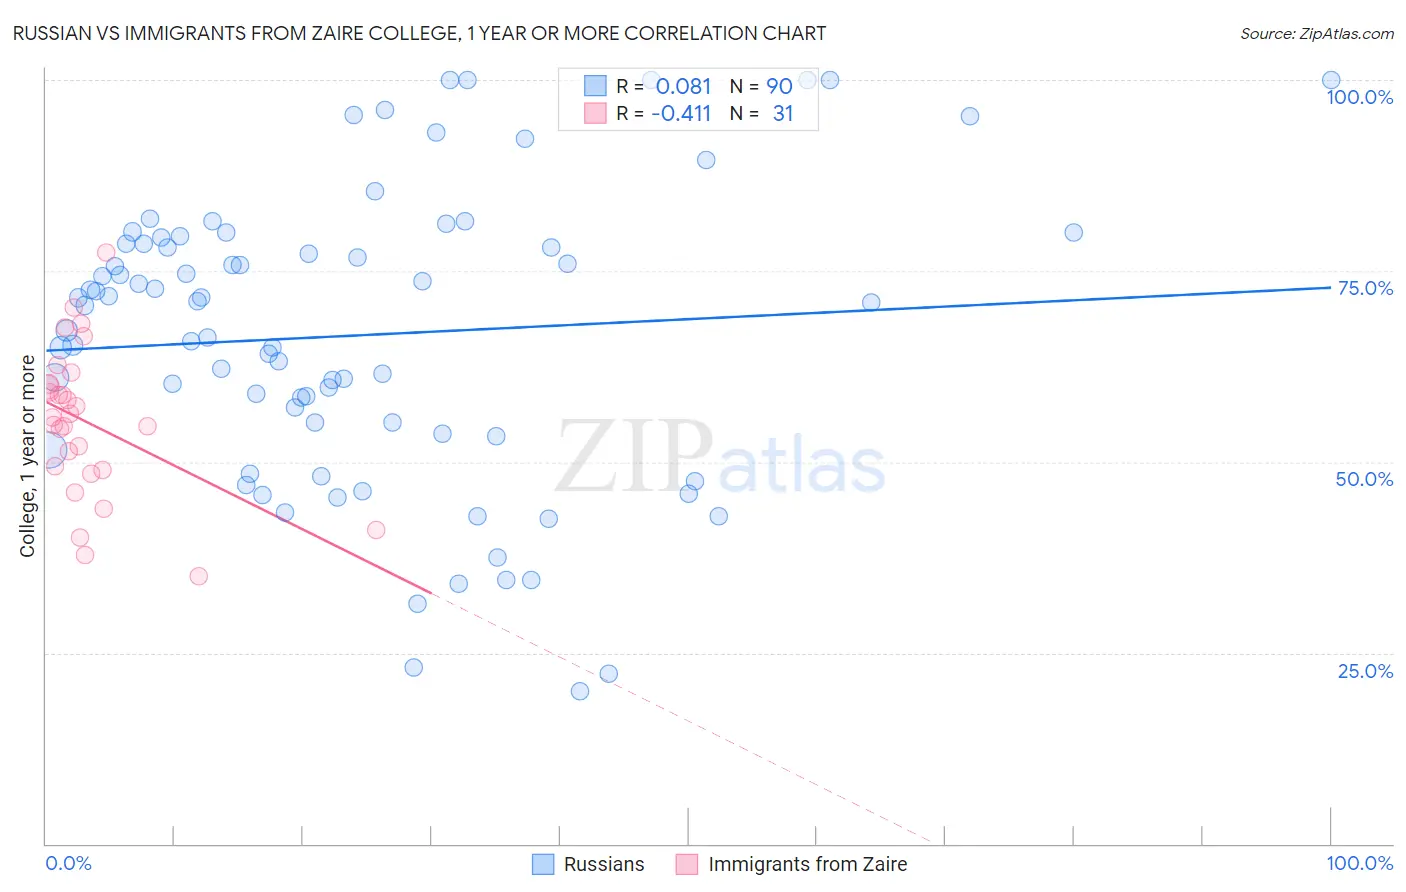
Russian vs Immigrants from Zaire College, 1 year or more Correlation Chart
The statistical analysis conducted on geographies consisting of 512,253,634 people shows a slight positive correlation between the proportion of Russians and percentage of population with at least college, 1 year or more education in the United States with a correlation coefficient (R) of 0.081 and weighted average of 65.1%. Similarly, the statistical analysis conducted on geographies consisting of 107,255,700 people shows a moderate negative correlation between the proportion of Immigrants from Zaire and percentage of population with at least college, 1 year or more education in the United States with a correlation coefficient (R) of -0.411 and weighted average of 58.3%, a difference of 11.8%.
College, 1 year or more Correlation Summary
| Measurement | Russian | Immigrants from Zaire |
| Minimum | 20.0% | 35.0% |
| Maximum | 100.0% | 77.4% |
| Range | 80.0% | 42.4% |
| Mean | 66.6% | 55.2% |
| Median | 70.6% | 55.8% |
| Interquartile 25% (IQ1) | 53.7% | 48.9% |
| Interquartile 75% (IQ3) | 78.6% | 60.2% |
| Interquartile Range (IQR) | 24.9% | 11.3% |
| Standard Deviation (Sample) | 19.2% | 9.8% |
| Standard Deviation (Population) | 19.1% | 9.6% |
Similar Demographics by College, 1 year or more
Demographics Similar to Russians by College, 1 year or more
In terms of college, 1 year or more, the demographic groups most similar to Russians are Immigrants from South Africa (65.1%, a difference of 0.010%), Immigrants from Turkey (65.2%, a difference of 0.090%), Immigrants from Saudi Arabia (65.0%, a difference of 0.15%), Estonian (65.0%, a difference of 0.22%), and Israeli (65.3%, a difference of 0.28%).
| Demographics | Rating | Rank | College, 1 year or more |
| Immigrants | Denmark | 100.0 /100 | #30 | Exceptional 65.6% |
| Turks | 100.0 /100 | #31 | Exceptional 65.5% |
| Bulgarians | 100.0 /100 | #32 | Exceptional 65.5% |
| Immigrants | Sri Lanka | 99.9 /100 | #33 | Exceptional 65.4% |
| Israelis | 99.9 /100 | #34 | Exceptional 65.3% |
| Immigrants | Turkey | 99.9 /100 | #35 | Exceptional 65.2% |
| Immigrants | South Africa | 99.9 /100 | #36 | Exceptional 65.1% |
| Russians | 99.9 /100 | #37 | Exceptional 65.1% |
| Immigrants | Saudi Arabia | 99.9 /100 | #38 | Exceptional 65.0% |
| Estonians | 99.9 /100 | #39 | Exceptional 65.0% |
| Immigrants | Kuwait | 99.9 /100 | #40 | Exceptional 65.0% |
| Mongolians | 99.9 /100 | #41 | Exceptional 64.8% |
| Immigrants | Latvia | 99.9 /100 | #42 | Exceptional 64.8% |
| Immigrants | Russia | 99.9 /100 | #43 | Exceptional 64.7% |
| Immigrants | Norway | 99.9 /100 | #44 | Exceptional 64.7% |
Demographics Similar to Immigrants from Zaire by College, 1 year or more
In terms of college, 1 year or more, the demographic groups most similar to Immigrants from Zaire are Immigrants from Vietnam (58.2%, a difference of 0.040%), Panamanian (58.3%, a difference of 0.050%), Senegalese (58.2%, a difference of 0.16%), Ghanaian (58.4%, a difference of 0.19%), and Immigrants from South America (58.4%, a difference of 0.27%).
| Demographics | Rating | Rank | College, 1 year or more |
| Immigrants | South Eastern Asia | 25.1 /100 | #198 | Fair 58.5% |
| Slovaks | 24.6 /100 | #199 | Fair 58.5% |
| Spanish | 24.2 /100 | #200 | Fair 58.5% |
| Nigerians | 23.0 /100 | #201 | Fair 58.5% |
| Immigrants | South America | 21.9 /100 | #202 | Fair 58.4% |
| Ghanaians | 20.9 /100 | #203 | Fair 58.4% |
| Panamanians | 19.2 /100 | #204 | Poor 58.3% |
| Immigrants | Zaire | 18.7 /100 | #205 | Poor 58.3% |
| Immigrants | Vietnam | 18.2 /100 | #206 | Poor 58.2% |
| Senegalese | 16.9 /100 | #207 | Poor 58.2% |
| Immigrants | Uruguay | 15.2 /100 | #208 | Poor 58.1% |
| Immigrants | Middle Africa | 14.0 /100 | #209 | Poor 58.0% |
| Tsimshian | 13.5 /100 | #210 | Poor 57.9% |
| Immigrants | Nigeria | 13.3 /100 | #211 | Poor 57.9% |
| Immigrants | Senegal | 11.8 /100 | #212 | Poor 57.8% |