Russian vs Palestinian College, 1 year or more
COMPARE
Russian
Palestinian
College, 1 year or more
College, 1 year or more Comparison
Russians
Palestinians
65.1%
COLLEGE, 1 YEAR OR MORE
99.9/ 100
METRIC RATING
37th/ 347
METRIC RANK
62.0%
COLLEGE, 1 YEAR OR MORE
96.3/ 100
METRIC RATING
106th/ 347
METRIC RANK
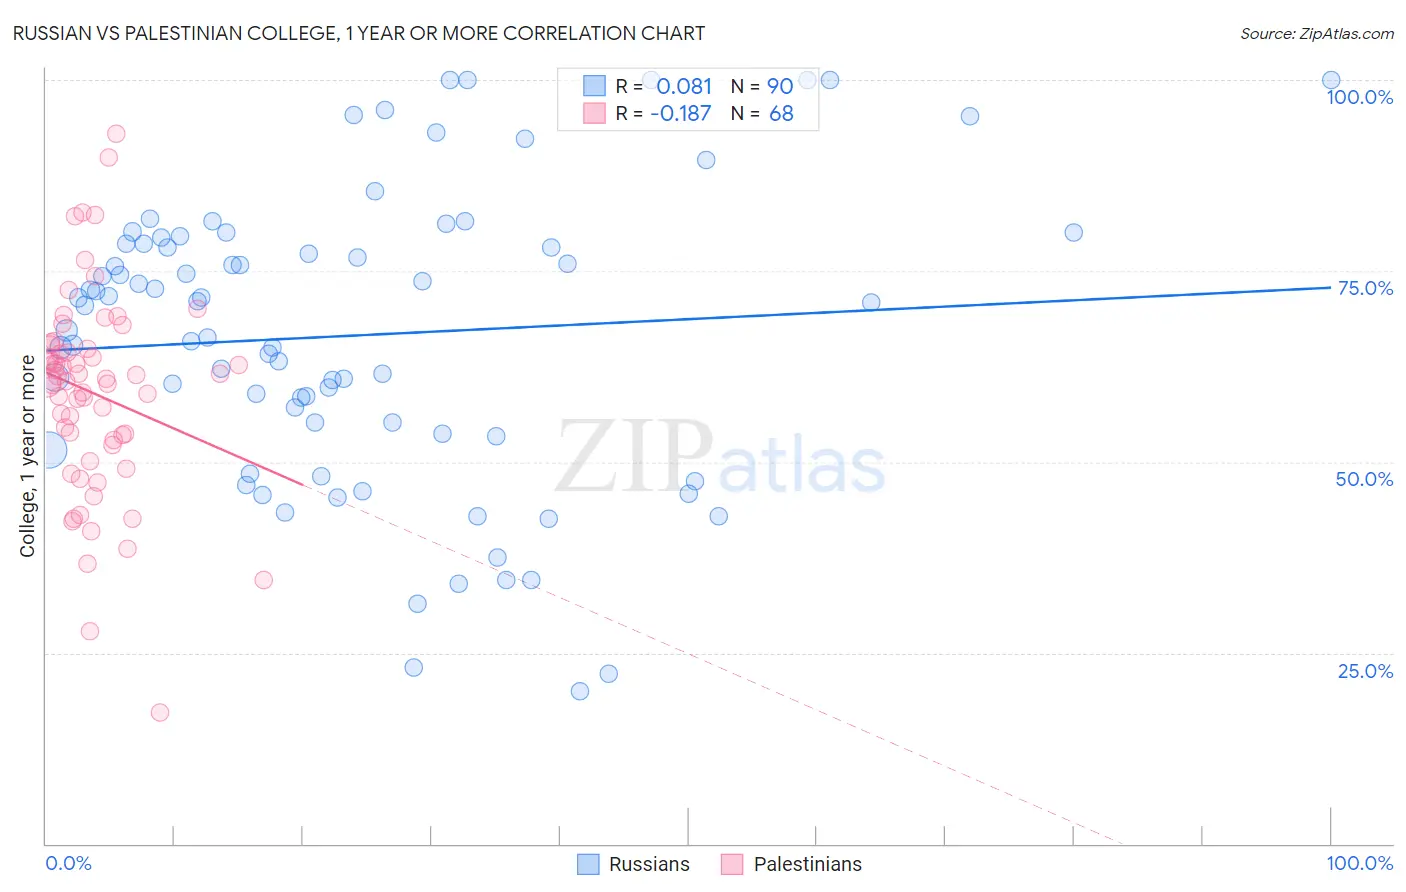
Russian vs Palestinian College, 1 year or more Correlation Chart
The statistical analysis conducted on geographies consisting of 512,253,634 people shows a slight positive correlation between the proportion of Russians and percentage of population with at least college, 1 year or more education in the United States with a correlation coefficient (R) of 0.081 and weighted average of 65.1%. Similarly, the statistical analysis conducted on geographies consisting of 216,461,838 people shows a poor negative correlation between the proportion of Palestinians and percentage of population with at least college, 1 year or more education in the United States with a correlation coefficient (R) of -0.187 and weighted average of 62.0%, a difference of 5.1%.
College, 1 year or more Correlation Summary
| Measurement | Russian | Palestinian |
| Minimum | 20.0% | 17.1% |
| Maximum | 100.0% | 92.9% |
| Range | 80.0% | 75.8% |
| Mean | 66.6% | 58.9% |
| Median | 70.6% | 60.7% |
| Interquartile 25% (IQ1) | 53.7% | 52.5% |
| Interquartile 75% (IQ3) | 78.6% | 65.1% |
| Interquartile Range (IQR) | 24.9% | 12.6% |
| Standard Deviation (Sample) | 19.2% | 13.4% |
| Standard Deviation (Population) | 19.1% | 13.3% |
Similar Demographics by College, 1 year or more
Demographics Similar to Russians by College, 1 year or more
In terms of college, 1 year or more, the demographic groups most similar to Russians are Immigrants from South Africa (65.1%, a difference of 0.010%), Immigrants from Turkey (65.2%, a difference of 0.090%), Immigrants from Saudi Arabia (65.0%, a difference of 0.15%), Estonian (65.0%, a difference of 0.22%), and Israeli (65.3%, a difference of 0.28%).
| Demographics | Rating | Rank | College, 1 year or more |
| Immigrants | Denmark | 100.0 /100 | #30 | Exceptional 65.6% |
| Turks | 100.0 /100 | #31 | Exceptional 65.5% |
| Bulgarians | 100.0 /100 | #32 | Exceptional 65.5% |
| Immigrants | Sri Lanka | 99.9 /100 | #33 | Exceptional 65.4% |
| Israelis | 99.9 /100 | #34 | Exceptional 65.3% |
| Immigrants | Turkey | 99.9 /100 | #35 | Exceptional 65.2% |
| Immigrants | South Africa | 99.9 /100 | #36 | Exceptional 65.1% |
| Russians | 99.9 /100 | #37 | Exceptional 65.1% |
| Immigrants | Saudi Arabia | 99.9 /100 | #38 | Exceptional 65.0% |
| Estonians | 99.9 /100 | #39 | Exceptional 65.0% |
| Immigrants | Kuwait | 99.9 /100 | #40 | Exceptional 65.0% |
| Mongolians | 99.9 /100 | #41 | Exceptional 64.8% |
| Immigrants | Latvia | 99.9 /100 | #42 | Exceptional 64.8% |
| Immigrants | Russia | 99.9 /100 | #43 | Exceptional 64.7% |
| Immigrants | Norway | 99.9 /100 | #44 | Exceptional 64.7% |
Demographics Similar to Palestinians by College, 1 year or more
In terms of college, 1 year or more, the demographic groups most similar to Palestinians are Immigrants from Nepal (62.0%, a difference of 0.0%), Chilean (62.0%, a difference of 0.020%), Afghan (62.0%, a difference of 0.030%), Luxembourger (62.1%, a difference of 0.15%), and Icelander (62.1%, a difference of 0.17%).
| Demographics | Rating | Rank | College, 1 year or more |
| Croatians | 97.1 /100 | #99 | Exceptional 62.2% |
| Icelanders | 96.8 /100 | #100 | Exceptional 62.1% |
| Swedes | 96.8 /100 | #101 | Exceptional 62.1% |
| Luxembourgers | 96.7 /100 | #102 | Exceptional 62.1% |
| Afghans | 96.4 /100 | #103 | Exceptional 62.0% |
| Chileans | 96.4 /100 | #104 | Exceptional 62.0% |
| Immigrants | Nepal | 96.3 /100 | #105 | Exceptional 62.0% |
| Palestinians | 96.3 /100 | #106 | Exceptional 62.0% |
| Immigrants | Ukraine | 95.8 /100 | #107 | Exceptional 61.9% |
| Syrians | 95.7 /100 | #108 | Exceptional 61.9% |
| Immigrants | Northern Africa | 95.7 /100 | #109 | Exceptional 61.9% |
| Europeans | 95.6 /100 | #110 | Exceptional 61.8% |
| Macedonians | 95.6 /100 | #111 | Exceptional 61.8% |
| Austrians | 95.4 /100 | #112 | Exceptional 61.8% |
| Ukrainians | 95.2 /100 | #113 | Exceptional 61.8% |