Russian vs Immigrants from Bulgaria College, 1 year or more
COMPARE
Russian
Immigrants from Bulgaria
College, 1 year or more
College, 1 year or more Comparison
Russians
Immigrants from Bulgaria
65.1%
COLLEGE, 1 YEAR OR MORE
99.9/ 100
METRIC RATING
37th/ 347
METRIC RANK
64.6%
COLLEGE, 1 YEAR OR MORE
99.9/ 100
METRIC RATING
48th/ 347
METRIC RANK
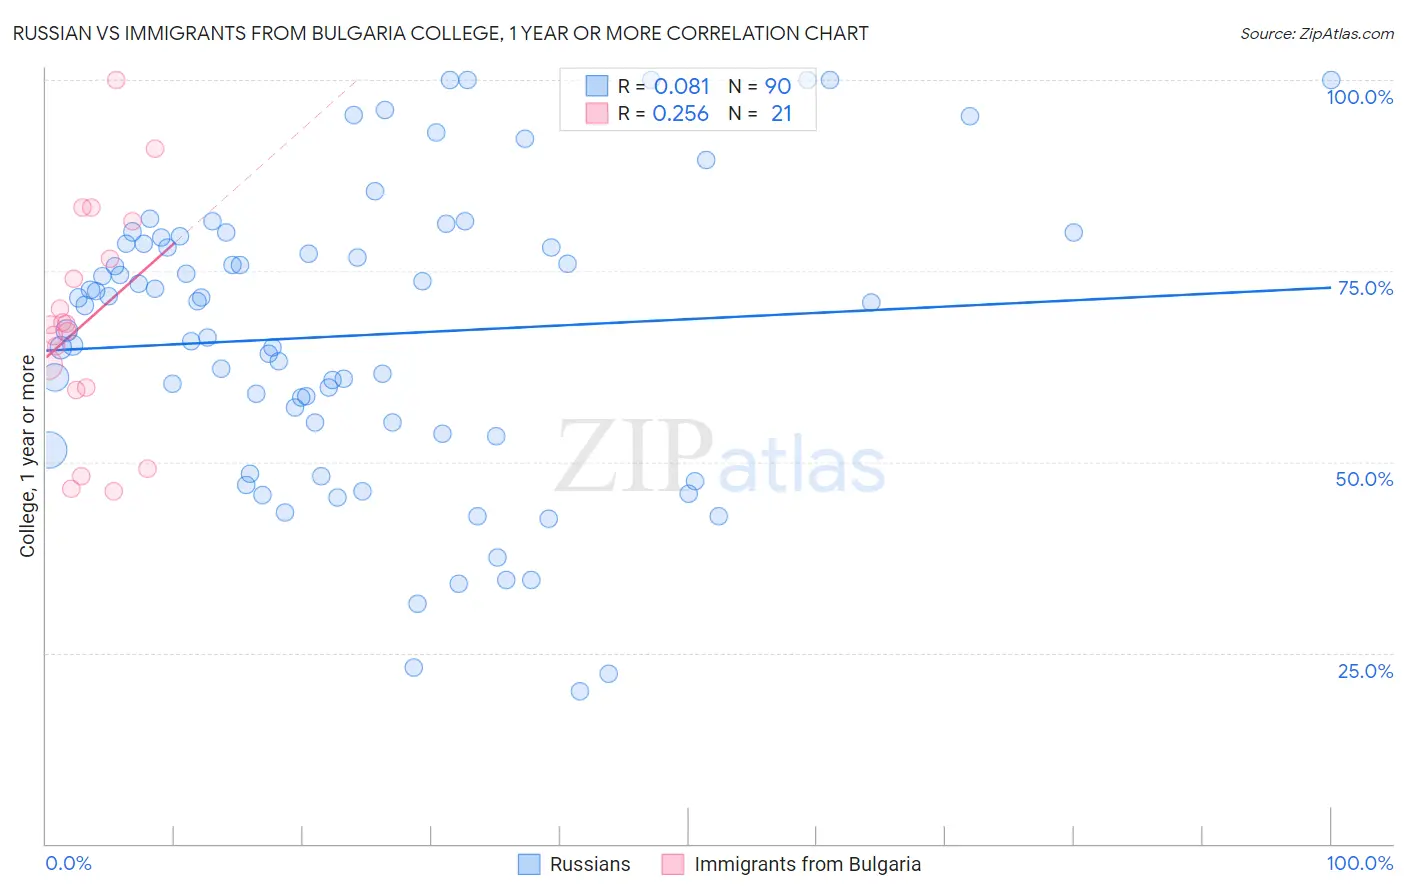
Russian vs Immigrants from Bulgaria College, 1 year or more Correlation Chart
The statistical analysis conducted on geographies consisting of 512,253,634 people shows a slight positive correlation between the proportion of Russians and percentage of population with at least college, 1 year or more education in the United States with a correlation coefficient (R) of 0.081 and weighted average of 65.1%. Similarly, the statistical analysis conducted on geographies consisting of 172,550,092 people shows a weak positive correlation between the proportion of Immigrants from Bulgaria and percentage of population with at least college, 1 year or more education in the United States with a correlation coefficient (R) of 0.256 and weighted average of 64.6%, a difference of 0.85%.
College, 1 year or more Correlation Summary
| Measurement | Russian | Immigrants from Bulgaria |
| Minimum | 20.0% | 46.2% |
| Maximum | 100.0% | 100.0% |
| Range | 80.0% | 53.8% |
| Mean | 66.6% | 68.3% |
| Median | 70.6% | 68.0% |
| Interquartile 25% (IQ1) | 53.7% | 59.6% |
| Interquartile 75% (IQ3) | 78.6% | 79.1% |
| Interquartile Range (IQR) | 24.9% | 19.5% |
| Standard Deviation (Sample) | 19.2% | 14.5% |
| Standard Deviation (Population) | 19.1% | 14.1% |
Demographics Similar to Russians and Immigrants from Bulgaria by College, 1 year or more
In terms of college, 1 year or more, the demographic groups most similar to Russians are Immigrants from South Africa (65.1%, a difference of 0.010%), Immigrants from Turkey (65.2%, a difference of 0.090%), Immigrants from Saudi Arabia (65.0%, a difference of 0.15%), Estonian (65.0%, a difference of 0.22%), and Israeli (65.3%, a difference of 0.28%). Similarly, the demographic groups most similar to Immigrants from Bulgaria are Australian (64.6%, a difference of 0.030%), Bhutanese (64.6%, a difference of 0.040%), New Zealander (64.6%, a difference of 0.040%), Immigrants from Lithuania (64.6%, a difference of 0.050%), and Immigrants from Norway (64.7%, a difference of 0.21%).
| Demographics | Rating | Rank | College, 1 year or more |
| Bulgarians | 100.0 /100 | #32 | Exceptional 65.5% |
| Immigrants | Sri Lanka | 99.9 /100 | #33 | Exceptional 65.4% |
| Israelis | 99.9 /100 | #34 | Exceptional 65.3% |
| Immigrants | Turkey | 99.9 /100 | #35 | Exceptional 65.2% |
| Immigrants | South Africa | 99.9 /100 | #36 | Exceptional 65.1% |
| Russians | 99.9 /100 | #37 | Exceptional 65.1% |
| Immigrants | Saudi Arabia | 99.9 /100 | #38 | Exceptional 65.0% |
| Estonians | 99.9 /100 | #39 | Exceptional 65.0% |
| Immigrants | Kuwait | 99.9 /100 | #40 | Exceptional 65.0% |
| Mongolians | 99.9 /100 | #41 | Exceptional 64.8% |
| Immigrants | Latvia | 99.9 /100 | #42 | Exceptional 64.8% |
| Immigrants | Russia | 99.9 /100 | #43 | Exceptional 64.7% |
| Immigrants | Norway | 99.9 /100 | #44 | Exceptional 64.7% |
| Immigrants | Lithuania | 99.9 /100 | #45 | Exceptional 64.6% |
| Bhutanese | 99.9 /100 | #46 | Exceptional 64.6% |
| Australians | 99.9 /100 | #47 | Exceptional 64.6% |
| Immigrants | Bulgaria | 99.9 /100 | #48 | Exceptional 64.6% |
| New Zealanders | 99.9 /100 | #49 | Exceptional 64.6% |
| Immigrants | Austria | 99.8 /100 | #50 | Exceptional 64.4% |
| Immigrants | Malaysia | 99.8 /100 | #51 | Exceptional 64.3% |
| Immigrants | Netherlands | 99.8 /100 | #52 | Exceptional 64.2% |