Romanian vs Immigrants from Trinidad and Tobago Unemployment Among Seniors over 65 years
COMPARE
Romanian
Immigrants from Trinidad and Tobago
Unemployment Among Seniors over 65 years
Unemployment Among Seniors over 65 years Comparison
Romanians
Immigrants from Trinidad and Tobago
5.0%
UNEMPLOYMENT AMONG SENIORS OVER 65 YEARS
95.5/ 100
METRIC RATING
100th/ 347
METRIC RANK
5.3%
UNEMPLOYMENT AMONG SENIORS OVER 65 YEARS
1.6/ 100
METRIC RATING
240th/ 347
METRIC RANK
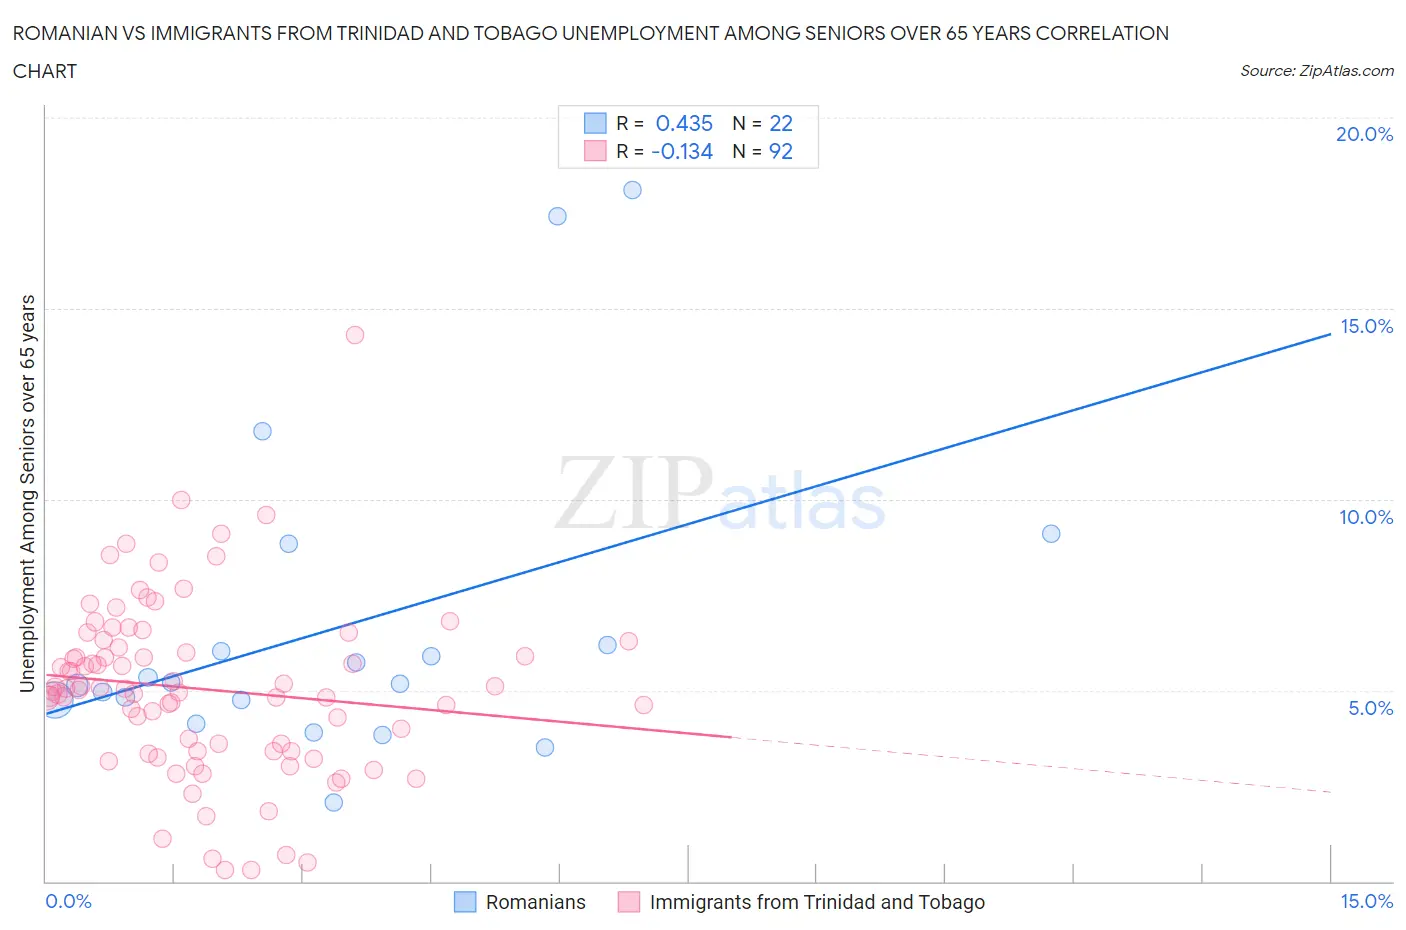
Romanian vs Immigrants from Trinidad and Tobago Unemployment Among Seniors over 65 years Correlation Chart
The statistical analysis conducted on geographies consisting of 342,784,127 people shows a moderate positive correlation between the proportion of Romanians and unemployment rate amomg seniors over the age of 65 in the United States with a correlation coefficient (R) of 0.435 and weighted average of 5.0%. Similarly, the statistical analysis conducted on geographies consisting of 211,047,389 people shows a poor negative correlation between the proportion of Immigrants from Trinidad and Tobago and unemployment rate amomg seniors over the age of 65 in the United States with a correlation coefficient (R) of -0.134 and weighted average of 5.3%, a difference of 5.9%.
Unemployment Among Seniors over 65 years Correlation Summary
| Measurement | Romanian | Immigrants from Trinidad and Tobago |
| Minimum | 2.1% | 0.30% |
| Maximum | 18.1% | 14.3% |
| Range | 16.0% | 14.0% |
| Mean | 6.7% | 5.0% |
| Median | 5.2% | 5.0% |
| Interquartile 25% (IQ1) | 4.7% | 3.4% |
| Interquartile 75% (IQ3) | 6.2% | 6.2% |
| Interquartile Range (IQR) | 1.5% | 2.8% |
| Standard Deviation (Sample) | 4.1% | 2.3% |
| Standard Deviation (Population) | 4.0% | 2.3% |
Similar Demographics by Unemployment Among Seniors over 65 years
Demographics Similar to Romanians by Unemployment Among Seniors over 65 years
In terms of unemployment among seniors over 65 years, the demographic groups most similar to Romanians are Yugoslavian (5.0%, a difference of 0.020%), Immigrants from Thailand (5.0%, a difference of 0.020%), Immigrants from Lithuania (5.0%, a difference of 0.080%), Immigrants from Scotland (5.0%, a difference of 0.10%), and Okinawan (5.0%, a difference of 0.15%).
| Demographics | Rating | Rank | Unemployment Among Seniors over 65 years |
| Austrians | 97.3 /100 | #93 | Exceptional 5.0% |
| Burmese | 96.8 /100 | #94 | Exceptional 5.0% |
| Assyrians/Chaldeans/Syriacs | 96.8 /100 | #95 | Exceptional 5.0% |
| Immigrants | Singapore | 96.8 /100 | #96 | Exceptional 5.0% |
| Immigrants | Oceania | 96.8 /100 | #97 | Exceptional 5.0% |
| Czechoslovakians | 96.7 /100 | #98 | Exceptional 5.0% |
| South Africans | 96.5 /100 | #99 | Exceptional 5.0% |
| Romanians | 95.5 /100 | #100 | Exceptional 5.0% |
| Yugoslavians | 95.4 /100 | #101 | Exceptional 5.0% |
| Immigrants | Thailand | 95.4 /100 | #102 | Exceptional 5.0% |
| Immigrants | Lithuania | 95.1 /100 | #103 | Exceptional 5.0% |
| Immigrants | Scotland | 95.0 /100 | #104 | Exceptional 5.0% |
| Okinawans | 94.7 /100 | #105 | Exceptional 5.0% |
| Immigrants | Turkey | 94.3 /100 | #106 | Exceptional 5.0% |
| Immigrants | Germany | 93.2 /100 | #107 | Exceptional 5.0% |
Demographics Similar to Immigrants from Trinidad and Tobago by Unemployment Among Seniors over 65 years
In terms of unemployment among seniors over 65 years, the demographic groups most similar to Immigrants from Trinidad and Tobago are Immigrants from Senegal (5.3%, a difference of 0.11%), Immigrants from Israel (5.3%, a difference of 0.17%), Apache (5.3%, a difference of 0.17%), Immigrants from Greece (5.3%, a difference of 0.18%), and Immigrants from Costa Rica (5.3%, a difference of 0.24%).
| Demographics | Rating | Rank | Unemployment Among Seniors over 65 years |
| Marshallese | 3.1 /100 | #233 | Tragic 5.3% |
| Blackfeet | 3.1 /100 | #234 | Tragic 5.3% |
| Immigrants | Albania | 2.7 /100 | #235 | Tragic 5.3% |
| Immigrants | Costa Rica | 2.1 /100 | #236 | Tragic 5.3% |
| Immigrants | Greece | 2.0 /100 | #237 | Tragic 5.3% |
| Immigrants | Israel | 2.0 /100 | #238 | Tragic 5.3% |
| Immigrants | Senegal | 1.8 /100 | #239 | Tragic 5.3% |
| Immigrants | Trinidad and Tobago | 1.6 /100 | #240 | Tragic 5.3% |
| Apache | 1.3 /100 | #241 | Tragic 5.3% |
| Bahamians | 0.9 /100 | #242 | Tragic 5.3% |
| Nigerians | 0.9 /100 | #243 | Tragic 5.3% |
| Peruvians | 0.8 /100 | #244 | Tragic 5.3% |
| Ottawa | 0.8 /100 | #245 | Tragic 5.3% |
| Colombians | 0.7 /100 | #246 | Tragic 5.3% |
| Immigrants | Caribbean | 0.7 /100 | #247 | Tragic 5.3% |