Puget Sound Salish vs Ottawa College, Under 1 year
COMPARE
Puget Sound Salish
Ottawa
College, Under 1 year
College, Under 1 year Comparison
Puget Sound Salish
Ottawa
63.9%
COLLEGE, UNDER 1 YEAR
11.3/ 100
METRIC RATING
209th/ 347
METRIC RANK
62.2%
COLLEGE, UNDER 1 YEAR
1.1/ 100
METRIC RATING
241st/ 347
METRIC RANK
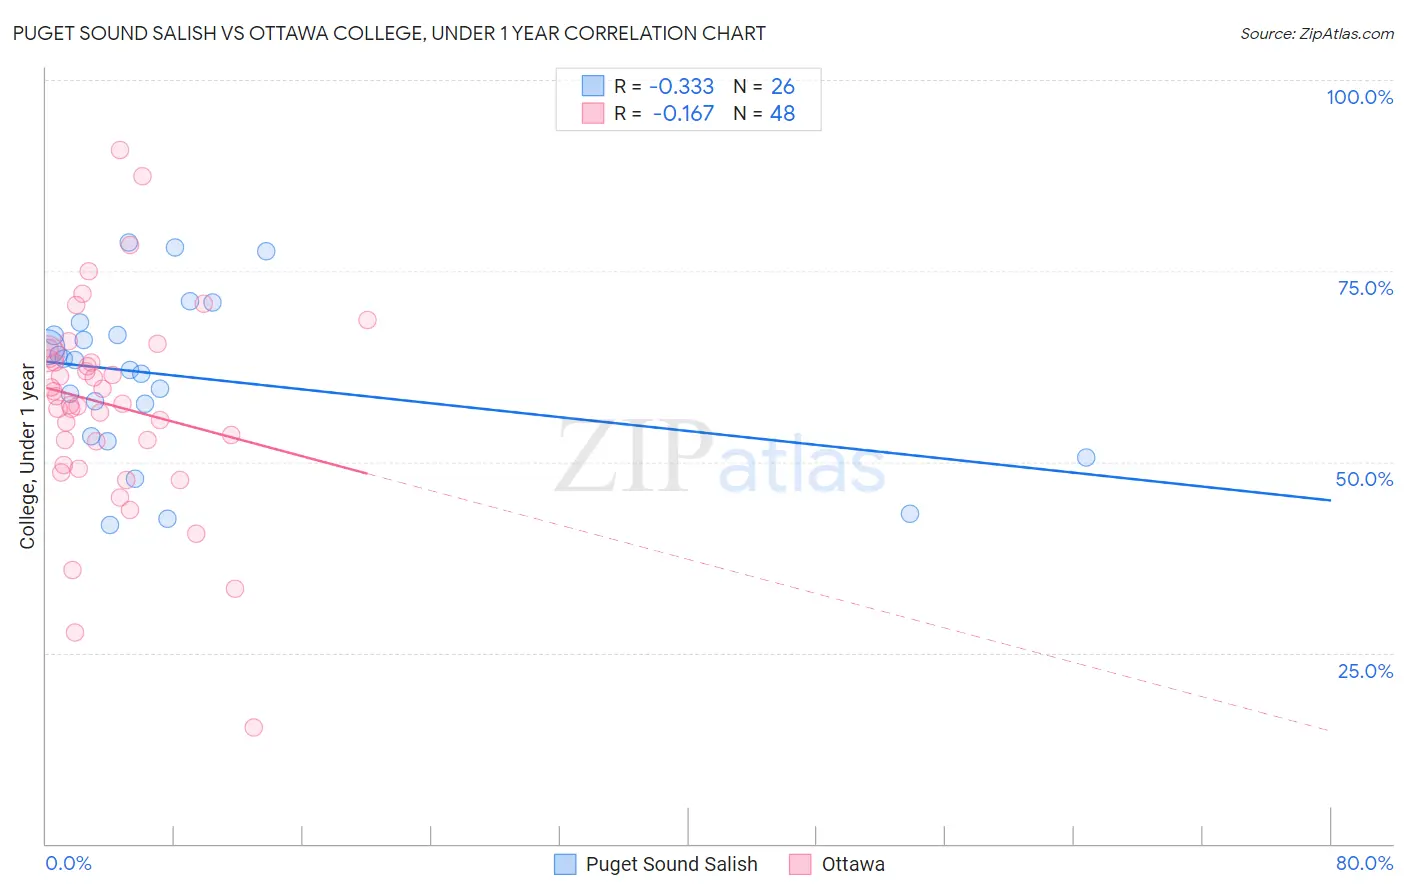
Puget Sound Salish vs Ottawa College, Under 1 year Correlation Chart
The statistical analysis conducted on geographies consisting of 46,155,865 people shows a mild negative correlation between the proportion of Puget Sound Salish and percentage of population with at least college, under 1 year education in the United States with a correlation coefficient (R) of -0.333 and weighted average of 63.9%. Similarly, the statistical analysis conducted on geographies consisting of 49,956,726 people shows a poor negative correlation between the proportion of Ottawa and percentage of population with at least college, under 1 year education in the United States with a correlation coefficient (R) of -0.167 and weighted average of 62.2%, a difference of 2.8%.
College, Under 1 year Correlation Summary
| Measurement | Puget Sound Salish | Ottawa |
| Minimum | 41.7% | 15.3% |
| Maximum | 78.8% | 90.8% |
| Range | 37.1% | 75.6% |
| Mean | 61.1% | 57.5% |
| Median | 62.7% | 58.1% |
| Interquartile 25% (IQ1) | 53.3% | 51.2% |
| Interquartile 75% (IQ3) | 66.7% | 63.8% |
| Interquartile Range (IQR) | 13.3% | 12.6% |
| Standard Deviation (Sample) | 10.4% | 13.6% |
| Standard Deviation (Population) | 10.2% | 13.5% |
Similar Demographics by College, Under 1 year
Demographics Similar to Puget Sound Salish by College, Under 1 year
In terms of college, under 1 year, the demographic groups most similar to Puget Sound Salish are Ghanaian (63.9%, a difference of 0.010%), Native Hawaiian (63.9%, a difference of 0.080%), Immigrants from Vietnam (64.0%, a difference of 0.090%), Immigrants from Middle Africa (63.9%, a difference of 0.090%), and Colombian (64.0%, a difference of 0.12%).
| Demographics | Rating | Rank | College, Under 1 year |
| South Americans | 16.2 /100 | #202 | Poor 64.2% |
| Uruguayans | 15.6 /100 | #203 | Poor 64.2% |
| Immigrants | Zaire | 14.6 /100 | #204 | Poor 64.1% |
| Peruvians | 13.7 /100 | #205 | Poor 64.1% |
| Whites/Caucasians | 12.8 /100 | #206 | Poor 64.0% |
| Colombians | 12.4 /100 | #207 | Poor 64.0% |
| Immigrants | Vietnam | 12.1 /100 | #208 | Poor 64.0% |
| Puget Sound Salish | 11.3 /100 | #209 | Poor 63.9% |
| Ghanaians | 11.2 /100 | #210 | Poor 63.9% |
| Native Hawaiians | 10.6 /100 | #211 | Poor 63.9% |
| Immigrants | Middle Africa | 10.5 /100 | #212 | Poor 63.9% |
| Immigrants | South America | 9.1 /100 | #213 | Tragic 63.8% |
| Immigrants | Nigeria | 8.8 /100 | #214 | Tragic 63.7% |
| Senegalese | 7.7 /100 | #215 | Tragic 63.6% |
| Hmong | 6.8 /100 | #216 | Tragic 63.5% |
Demographics Similar to Ottawa by College, Under 1 year
In terms of college, under 1 year, the demographic groups most similar to Ottawa are Nepalese (62.2%, a difference of 0.010%), Aleut (62.2%, a difference of 0.010%), Malaysian (62.2%, a difference of 0.050%), Hawaiian (62.1%, a difference of 0.080%), and Colville (62.1%, a difference of 0.17%).
| Demographics | Rating | Rank | College, Under 1 year |
| Chippewa | 2.0 /100 | #234 | Tragic 62.6% |
| Spanish Americans | 1.9 /100 | #235 | Tragic 62.6% |
| Immigrants | Immigrants | 1.7 /100 | #236 | Tragic 62.5% |
| Immigrants | Burma/Myanmar | 1.6 /100 | #237 | Tragic 62.5% |
| French American Indians | 1.5 /100 | #238 | Tragic 62.4% |
| Nepalese | 1.1 /100 | #239 | Tragic 62.2% |
| Aleuts | 1.1 /100 | #240 | Tragic 62.2% |
| Ottawa | 1.1 /100 | #241 | Tragic 62.2% |
| Malaysians | 1.1 /100 | #242 | Tragic 62.2% |
| Hawaiians | 1.1 /100 | #243 | Tragic 62.1% |
| Colville | 1.0 /100 | #244 | Tragic 62.1% |
| Delaware | 0.9 /100 | #245 | Tragic 62.1% |
| Marshallese | 0.8 /100 | #246 | Tragic 61.9% |
| Immigrants | Liberia | 0.8 /100 | #247 | Tragic 61.9% |
| Potawatomi | 0.6 /100 | #248 | Tragic 61.8% |